使用chrome remote debug时打开inspect时出现一片空白 #1
Comments
|
我已经翻墙了,谷歌搜索都能正常使用,但是还是空白 |
|
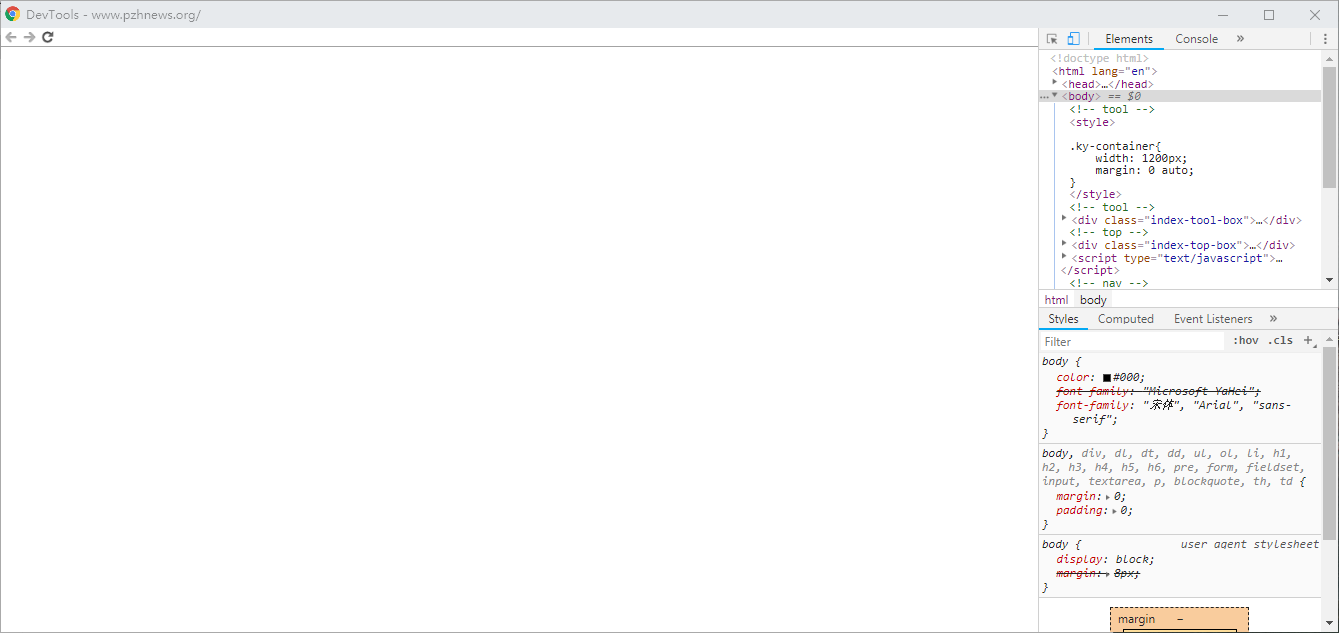
是可以的。参见附件:
|
|
@yuyongyu08 改一下hosts试一试 74.125.25.141 chrome-devtools-frontend.appspot.com |
|
chrome://appcache-internals/# see it https://segmentfault.com/a/1190000007785694?_ea=2780177 |
|
@HuarenYu not work now |
|
@someoneoylp 开个全局模式试下,我翻墙可以访问哦 |
|
调试的时候,个别页面一片黑,但是在elements 页面选择div 等还是能显示标签大小信息的是怎么回事? |
|
调试的时候,个别页面一片黑,但是在elements 页面选择div 等还是能显示标签大小信息的是怎么回事? |
|
@ksx159 @AndySmiths @cuijiudai @someoneoylp |
|
加了hosts |
|
@HuarenYu FreeVPNSetup.exe这个软件好像不能用了,大佬有新的翻墙方法吗? |
|
我在检查器里面能够看见dom节点 但是里面都是空的 除了script标签 |
|
@Black-Kitten 你翻墙了吗? |
没用啊 |

因为chrome inspect需要加载 https://chrome-devtools-frontend.appspot.com 上的资源,所以需要翻墙。
googlearchive/ADBPlugin#14
The text was updated successfully, but these errors were encountered: