An interactive demo application for the algorithm proposed in our IEEE VIS 2019 technical paper. More details of our project can be found here.
The program also provides some interactive functions:
- select interested classes in the bottom left panel;
- drag and select a local area, then you can select new grid size for this area;
- the information of the local area you selected will be shown in the right panel.
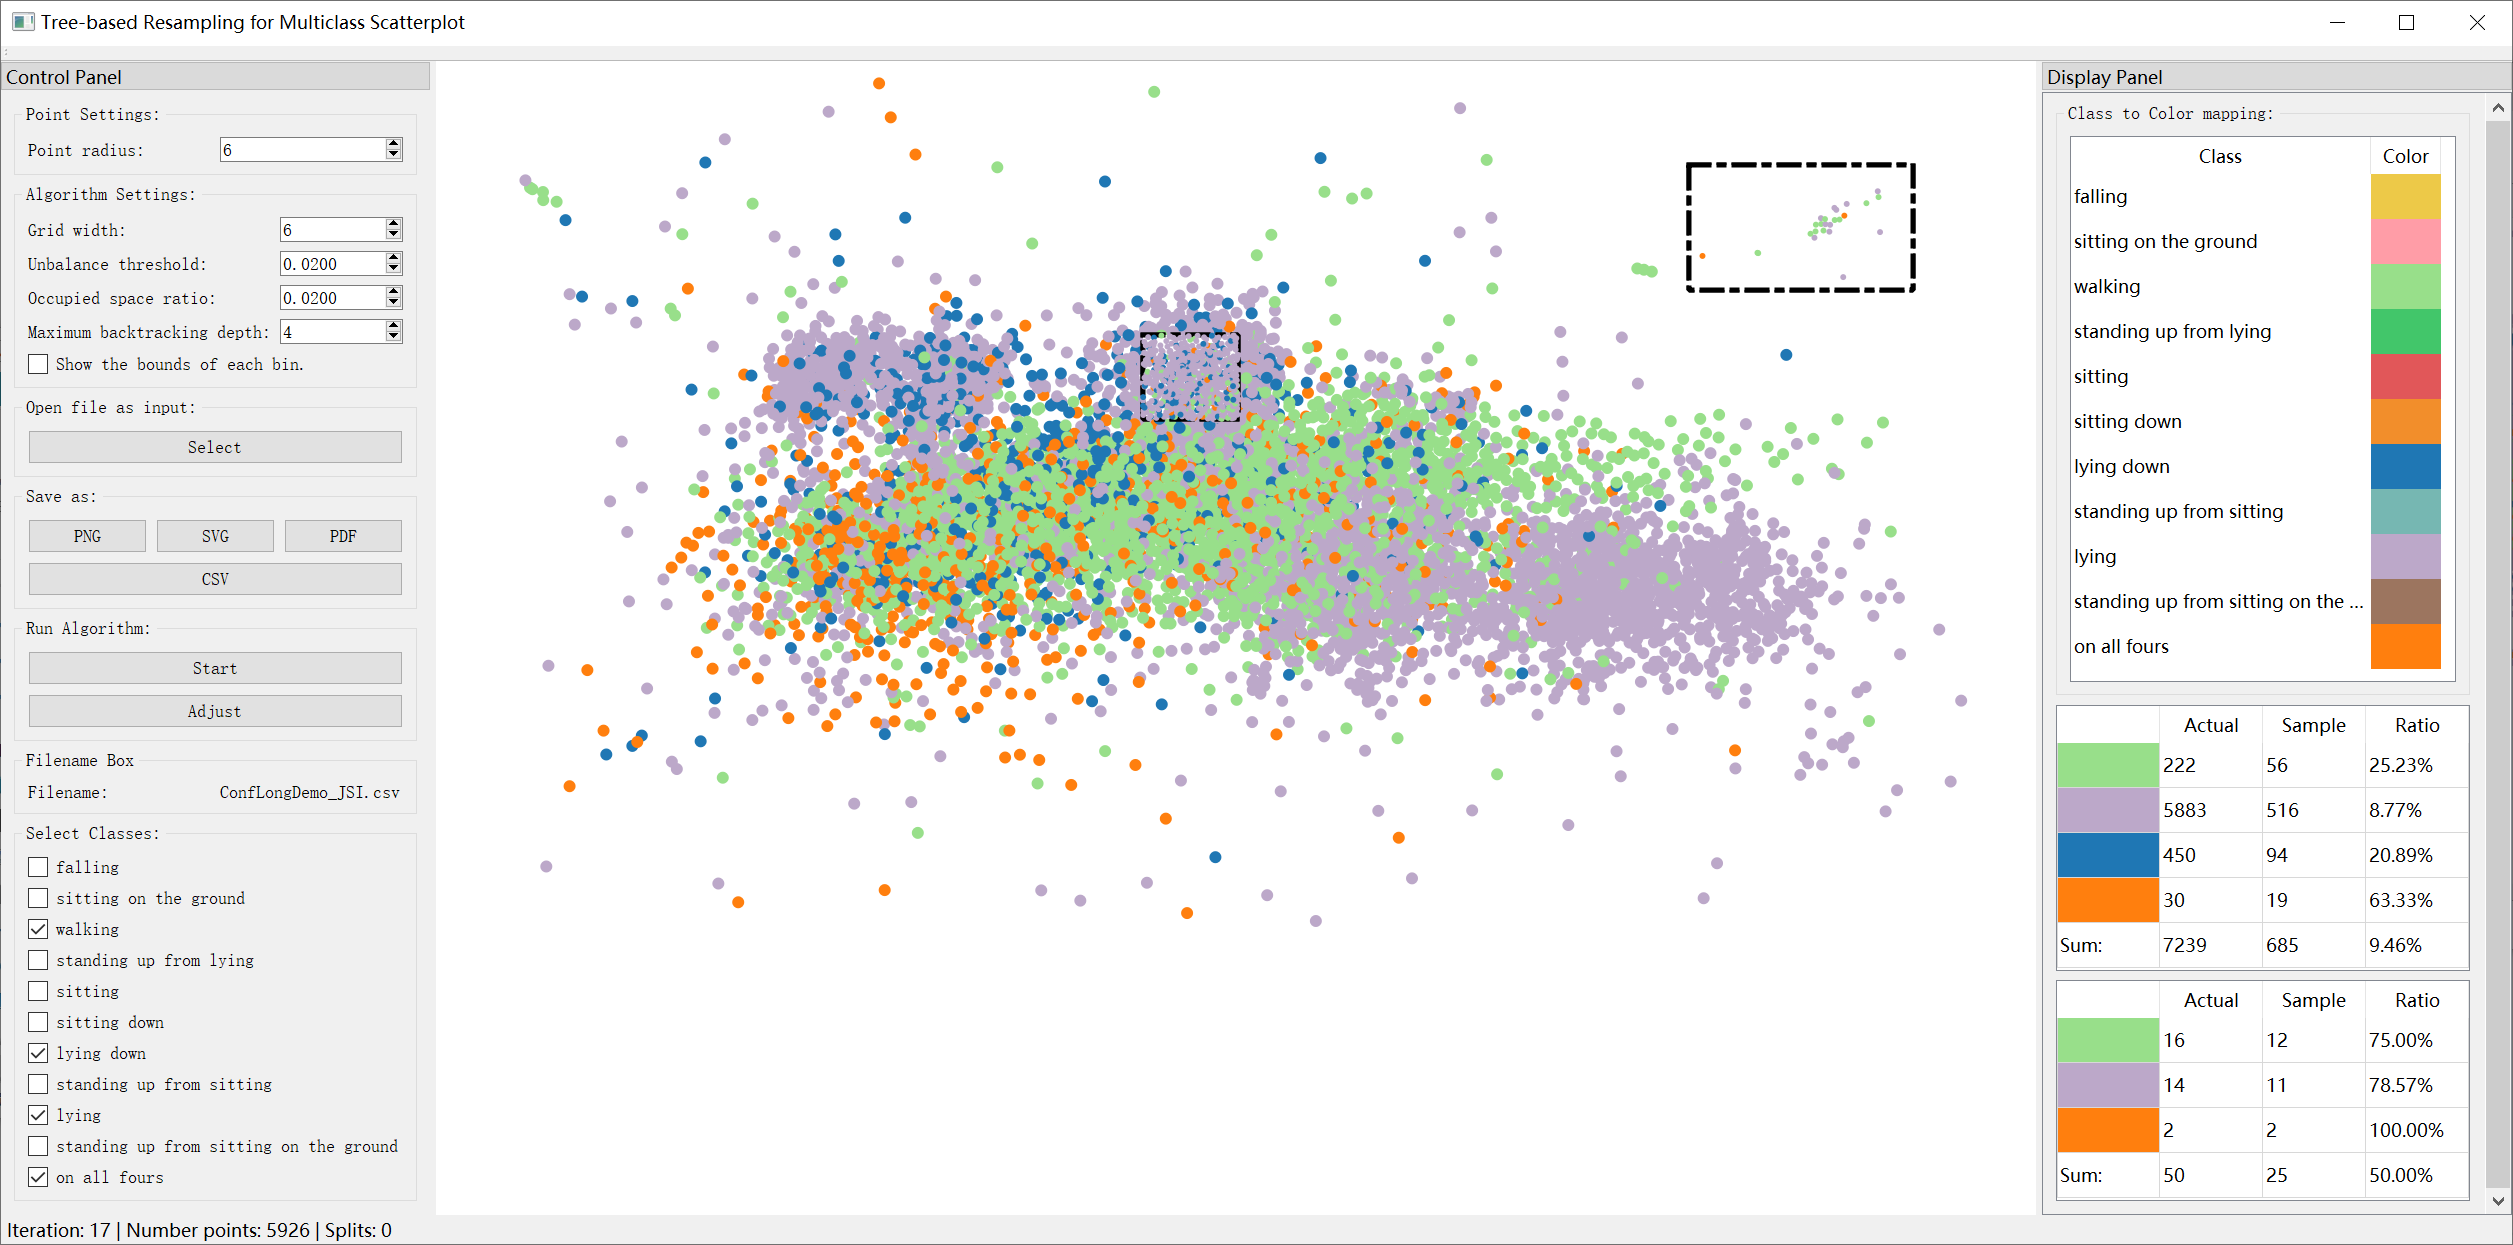

This is a reimplemented demo with focus on interactivity, and not the code that was used to generate the images and timings in the paper.
We present a non-uniform recursive sampling technique for multi-class scatterplots, with the specific goal of faithfully presenting relative data and class densities, while preserving major outliers in the plots. Our technique is based on a customized binary kd-tree, in which leaf nodes are created by recursively subdividing the underlying multi-class density map. By backtracking, we merge leaf nodes until they encompass points of all classes for our subsequently applied outlier-aware multi-class sampling strategy. A quantitative evaluation shows that our approach can better preserve outliers and at the same time relative densities in multi-class scatterplots compared to the previous approaches, several case studies demonstrate the effectiveness of our approach in exploring complex and real world data.
@ARTICLE{sampling2019,
author={X. {Chen} and T. {Ge} and J. {Zhang} and B. {Chen} and C. {Fu} and O. {Deussen} and Y. {Wang}},
journal={IEEE Transactions on Visualization and Computer Graphics},
title={A Recursive Subdivision Technique for Sampling Multi-class Scatterplots},
year={2020},
volume={26},
number={1},
pages={729-738},
keywords={Visualization;Data visualization;Measurement;Sampling methods;Estimation;Clutter;Image color analysis;Scatterplot;multi-class sampling;kd-tree;outlier;relative density},
doi={10.1109/TVCG.2019.2934541},
ISSN={2160-9306},
month={Jan}
}
The following libraries are required:
- Qt5Core
- Qt5GUI
- Qt5Widgets
- Qt5Svg
- Qt5PrintSupport