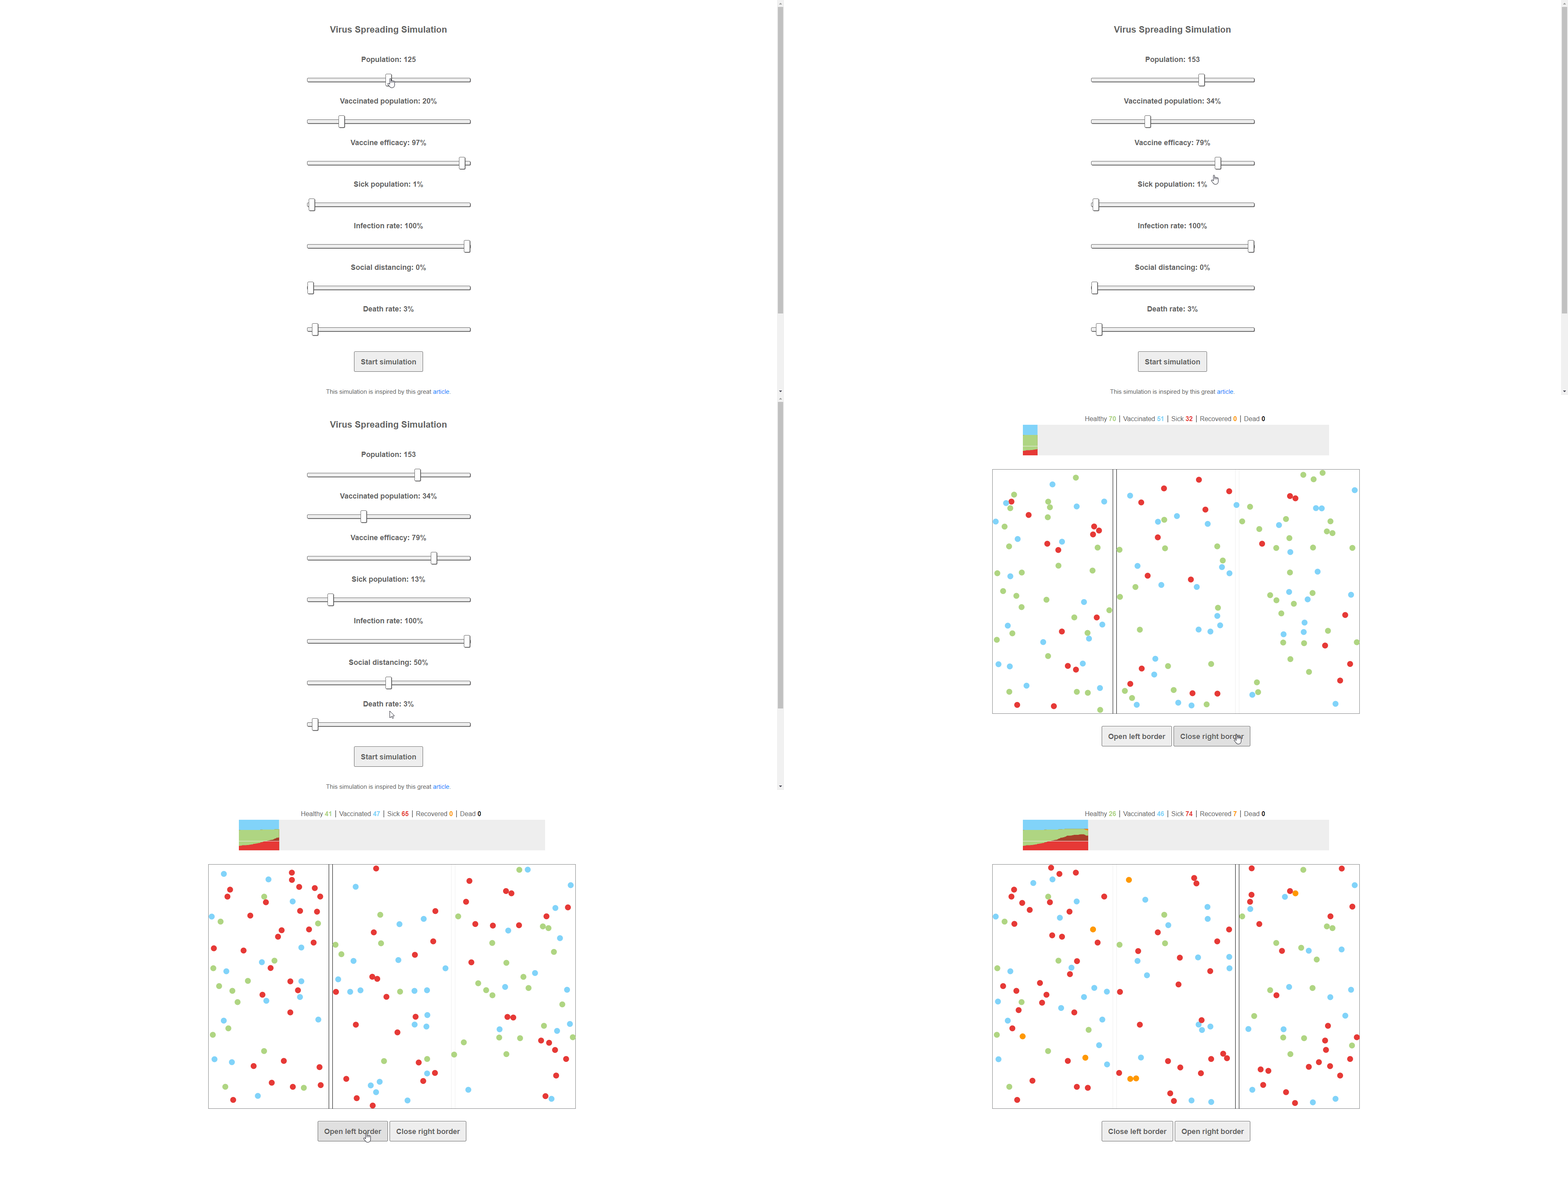
Simple virus spreading simulation inspired by this great article (written by Harry Stevens on WashingtonPost).
The goal of this tool is to experiment with several parameters to find the best way to "flatten the curve".
The whole simulation is made with plain/vanilla JavaScript and CSS. But why vanilla JavaScript (without some newer specification like ES6)? Because I wanted to be runnable in older/all browsers without using a JS compiler. Btw I'm not saying to ignore JS frameworks, JS compilers, or ES6 (they are great!), but for this project, I decided not to use something like that.
Note: This is not a mathematical simulation nor a 100% real-world simulation (because there are many more factors in the real world, and the people aren't just balls that are bouncing), but it could show how important the social distancing is and how quickly a virus could spread among the population.
Several details about the simulation:
- The simulation and chart are responsive and mobile-friendly.
- Each simulation lasts 30 seconds.
- A healthy ball (green) could be infected by a sick ball with a collision (the infection depends on the "infection rate" parameter).
- A sick ball (red) will be sick between 6 and 8 seconds. After that, it changes the state in recovered or dead (this depends on the "death rate" parameter). The number of sick balls depends on the "sick population" parameter.
- A recovered ball (orange) can't be infected again.
- A dead ball (black) is a ball that doesn't move and doesn't collide (doesn't exist for the other balls).
- Healthy, vaccinated, sick and recovered balls could be social distancing balls, which means that the ball doesn't move but the moving balls can collide with it. The number of social distancing balls depends on the "social distancing" parameter.
- In the chart there is a "safe limit" line (grey), that line is the hospital capacity, in this case, that limit is 30% of the total population (in the real-world this percent is much lower).
- Two new parameters were added to the original simulation (around 11 months later): "vaccinated" population (blue balls) and "vaccine efficiency". Vaccinated balls are blue. Each vaccinated ball may develop virus immunity, this depends on the "vaccine efficiency" parameter.
- images - logo (made by me, an amateur "designer") and a gif from the simulation
- src - the source code of the application
- index.html - a simple HTML page, JS and CSS files are imported and the parameters, notes, and canvases are defined here
- css/styles.css - used to define media queries (for responsiveness), and other very simple CSS rules (for buttons, ranges, and texts)
- js/common.js - all constants used in simulation
- js/vector2d.js - 2 dimensional vector class, all vector related things are located here
- js/ball.js - balls collision and movement logics/physics
- js/chart.js - chart logics and drawings
- js/simulation.js - simulation drawings and logics (without ball logics)
- js/app.js - the role of this js is to control the whole app/workflow, used to initialize (using the values from the parameters), stop the simulation and all other interaction
Useful resources about virus spreading (you can find the same resources in the application):
- Why outbreaks like coronavirus spread exponentially, and how to “flatten the curve”
- Outbreak
- What Happens Next?
- Epidemic Calculator
- Simulating an epidemic
- Epidemic, Endemic, and Eradication Simulations
- Exponential growth and epidemics
- What This Chart Actually Means for COVID-19
- The Coronavirus Curve
- How To See Germs Spread Experiment (Coronavirus)
- Visualizing Herd Immunity (with 500 Mousetraps!)
This project is licensed under the MIT - see the LICENSE file for details
