You signed in with another tab or window. Reload to refresh your session.You signed out in another tab or window. Reload to refresh your session.You switched accounts on another tab or window. Reload to refresh your session.Dismiss alert
I am getting into troubles when trying to estimate hysteresis and I would love some opinion from better brains than mine =)
Currently, to assess the potential presence of hysteresis, we calculate the percentage error as the difference between the dive and climb relative to the mean values.
However, I’m considering that it might make more sense to estimate this relative to the data range instead. I’m unsure if this approach is valid.
As illustrated in the two plots, when we compute the error using mean values, it suggests the error is negligible, even though it’s clearly significant and evident in the first plot. On the other hand, comparing the difference to the range values brings out the obvious up-down bias much more clearly.
Update:
Chatted to Eleanor and we decided we will keep both the range and the mean and add a row on the summary sheet to check for both
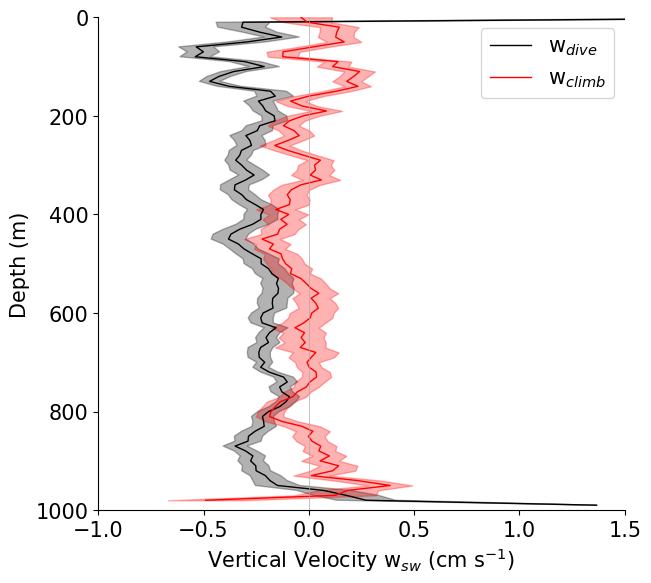
Tricky one! For something like vertical velocity, the mean should be small (near zero), so any bias between dive-average and climb-average will likely look large relative to the mean. The range for the mean w profile for dives and climbs could be relatively quite a bit larger, due to bad behaviour near the surface (attached plot, 2 cm/s for range, maybe -0.1 cm/s for mean). So it's the opposite problem as for salinity.
I think there could be (at least) 3 options:
percentage of the dive-climb difference (the delta) to the mean: $\frac{\Delta C}{\left<\overline{C}\right>}>0.02$. Problematic for things like salinity or density where the differences are small compared to the absolute value.
percentage of the dive-climb difference to the range: $\frac{\Delta C}{\mathrm{max}(\overline{C})-\mathrm{min}(\overline{C})}>0.02$. Problematic for--@MOchiara did you say this is a problem for optics?
or threshold $\left|\Delta C\right|>c_0$, where the threshold $c_0$ is set somehow by the expected accuracy (salinity better than.. 0.005? temperature better than 0.005? vertical velocity better than 0.05). Problematic for backscatter where it's not clear what the absolute numbers should be.
where $\left<\cdot\right>$ is the depth-mean, and $\overline{\cdot}$ is the time mean, so that $\overline{C}$ is the mean profile (still depends on z).
I am getting into troubles when trying to estimate hysteresis and I would love some opinion from better brains than mine =)
Currently, to assess the potential presence of hysteresis, we calculate the percentage error as the difference between the dive and climb relative to the mean values.
However, I’m considering that it might make more sense to estimate this relative to the data range instead. I’m unsure if this approach is valid.
As illustrated in the two plots, when we compute the error using mean values, it suggests the error is negligible, even though it’s clearly significant and evident in the first plot. On the other hand, comparing the difference to the range values brings out the obvious up-down bias much more clearly.
Update:
Chatted to Eleanor and we decided we will keep both the range and the mean and add a row on the summary sheet to check for both
The text was updated successfully, but these errors were encountered: