- Kyma ✅
- Cloud Foundry ✅
This part of the tutorial will provide deeper insights into creating a custom metric and explore the metric in SAP Cloud Logging service.
Follow these steps to create a custom metric that counts the number of requests to the service for each tenant, and then display the metric in the SAP Cloud Logging service.
-
Add below code in server.js file to create a custom metric and update the metric value for each request.
const { metrics } = require('@opentelemetry/api');
let counterRequestCountByTenant;

// Initialise 'Request Count by Tenant' Custom Counter
cds.on('listening', () => {
    counterRequestCountByTenant = metrics.getMeter('susaas.metering').createCounter('req.count.per.tenant');
})

// Add Middleware to update the 'Request Count by Tenant' Custom Counter
cds.middlewares.add((req, _, next) => {
    counterRequestCountByTenant.add(1, { 'susaas_tenant_id': cds.context.tenant })
    next()
})
explanation: In the above code, first, a custom counter is initialized with the name req.count.per.tenant once the server is ready and is listening to incoming erquests. Then, a middleware is added to the application to update the counter value for each request. The counter value is incremented by 1 for each request, and the tenant ID is used as a label to differentiate the requests from different tenants.
-
Once the code is added, build and deploy the application. Then you can explore the custom metric in the SAP Cloud Logging service.
-
Custom metric is automatically part of the OpenTelemetry explorer dashboard in the SAP Cloud Logging service.

-
Similarly, you can explore more details about custom metric using 'metrics-otel-v1-*' data source.

-
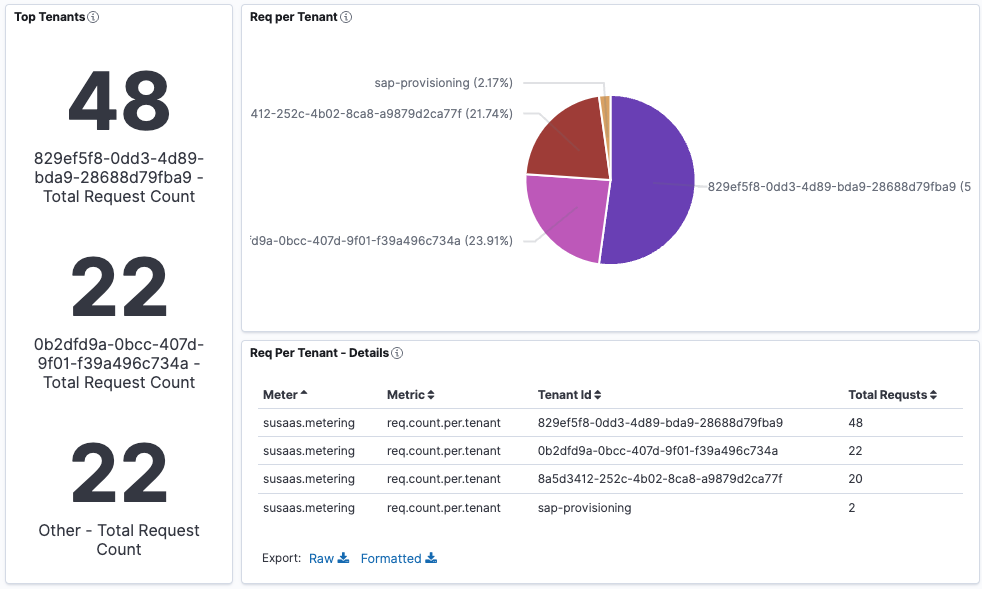
Lastly, you can also create a custom dashboard and visualization using the custom metric.

Note: If you are not able to see attributes of metric in the dashboard (e.g. susaas_tenant_id), It is due to indexing and can be refreshed by navigating to Stack Management --> Index Patterns and then open the index pattern metrics-otel-v1-* and click on Refresh field list button.


Please use the following links to find further information on the topics above: