-
Notifications
You must be signed in to change notification settings - Fork 2
New issue
Have a question about this project? Sign up for a free GitHub account to open an issue and contact its maintainers and the community.
By clicking “Sign up for GitHub”, you agree to our terms of service and privacy statement. We’ll occasionally send you account related emails.
Already on GitHub? Sign in to your account
Questions regarding to Strong and Scaling on Summit #1
Comments
|
hi Wenjie, for Titan, we see that the strong scaling falls off at about 500MB per process. thus, with NEX = 256 we will have 4GB per process on a 24 process simulation / 1GB for 96 processes / ~300 MB for 384 processes. at that time we should see the communication kicking in. so, strong scaling can easily be investigated with 3 simple simulations only. also, setting NEX = 256 will tell you what NPROC_XI values you can use: 1 / 2 / 4 / 8 / 16 / 32. on Summit, you might be able to run these benchmark simulations as low as NPROC_XI = 1. for the model, there is not much difference between using a 1D or 3D model. important parameters affecting the performance would be tiso model or not, full tiso or not, full attenuation or not. regarding record length, these benchmark simulations all set the DO_BENCHMARK_SIM.. flag in constants.h to true. thus, it will be fixed to 300 time steps. that’s fairly short, but since it also sets the initial wavefield to 1 everywhere (to avoid flushing-to-zero issues), it won’t blow up the simulation and the scaling measurements so far worked pretty well. you would want to plot “average run time per time step” anyway, so having more time steps will just use resources for hardly better results. note that the reasoning here is to test code scaling. finding an optimal setup for the simulations in INCITE would involve additional parameters and tests. also, note that for weak scaling, the script will choose different NEX values depending on the size of the simulation. for GLOBE, these simulations will all use a slightly different number of elements per slice (or process) and therefore the “load” will slightly change. for plotting weak scaling, this can be corrected by calculating the “average run time per time step PER ELEMENT”. if you then use a reference simulation with x elements per slice, you can easily plot weak scaling for an x-element simulation. as long as the memory per GPU is not falling below the critical value from above, this “correction“ works well and weak scaling should look almost perfect. best wishes, |
|
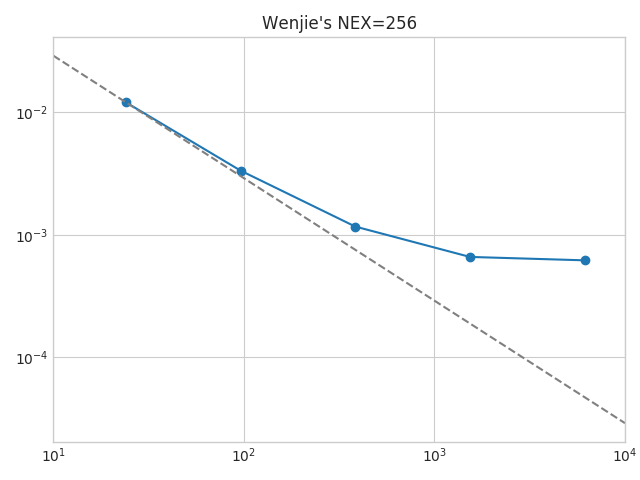
Hi Daniel, Thanks for the information. I just tested run the strong scaling using your setup. I used
From The I just checked that GPU on summit has 16GB...so I think the Below is the output_solver.txt file: I just added the results for |
|
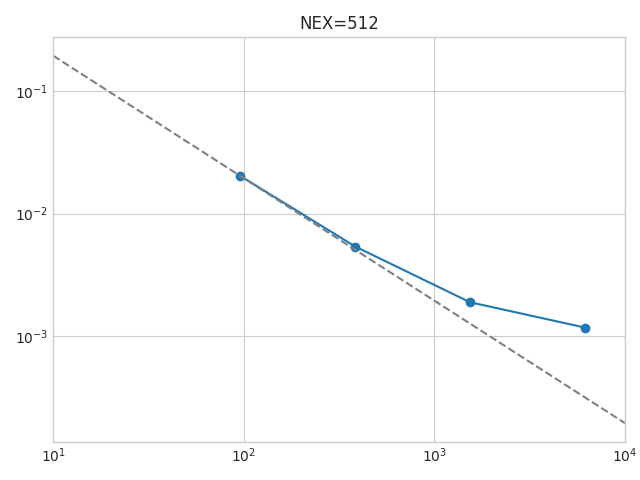
hi Wenjie, great, that looks interesting. your runtime at 96 procs is consistent with the one I made. so the scaling results seem to make sense. the 16GB memory on the GPU is unfortunately just slightly below what we would need for the 6 procs run (obviously some GPU memory is reserved for the scheduler/GPU system processes, thus not the whole 16 GB can be used :(. anyway, it's interesting to see that the strong scaling efficiency drops much faster on these Volta V100 cards than on the Kepler K20x cards. we really need to feed these GPU beasts enough work, otherwise they get bored too quickly and stand idle around waiting for the network to catch up. based on your scaling, the parallel efficiency just drops below 90% for nprocs > 96, that is when GPU memory loaded by the simulation is < 1GB per process (for Titan, this 90% threshold was reached at about < 500MB). so for this NEX simulation, we shouldn't run it on more than 96 GPUs otherwise we start waisting too much of the GPU power. also, it would be interesting to see this strong scaling for a larger simulation, say NEX = 512, to confirm the 1GB memory efficiency threshold. many thanks, |
|
Hi Daniel, Thanks for the feedback. Let me test on the I also did the weak scaling, the result is listed in the table:
How does those number look? Am I picking the right number to make measurements. The The GPU usage is bit low, though. The GPU memory usage varies from 1,162MB(7%) to 1,456MB(9%). |
|
Hi, After fixing the compile error, I also did the strong scaling benchmark on The result is listed below:
The result is very close to the Ridvan's run. So I think those results are stable and reliable. |
|
hi Wenjie and Ridvan, thanks for the benchmark numbers, they look pretty consistent.
Still, that is just a shift of the scaling curve. when i plot them, the weak scaling efficiency stays between 90 - 100% (figures in the results/ folder). that's fair enough. it is likely better when we use a higher NEX value (i.e. increasing the FACTOR parameter in the weak-scaling script to say 2). at least that is what i saw on Piz Daint. so, if we want to burn some more core-hours we could do that in future for weak scaling.
best wishes, |


Hi Daniel,
Thanks for putting all these together. I have some questions regarding to the parameters used for benchmark Summit@ORNL.
For the strong scaling how do I pick the parameters for strong scaling, including:
From my previous experience, it is a bit tricky to pick the problem size and GPU numbers. Because using least GPUs may blow out the GPU memory.
The text was updated successfully, but these errors were encountered: