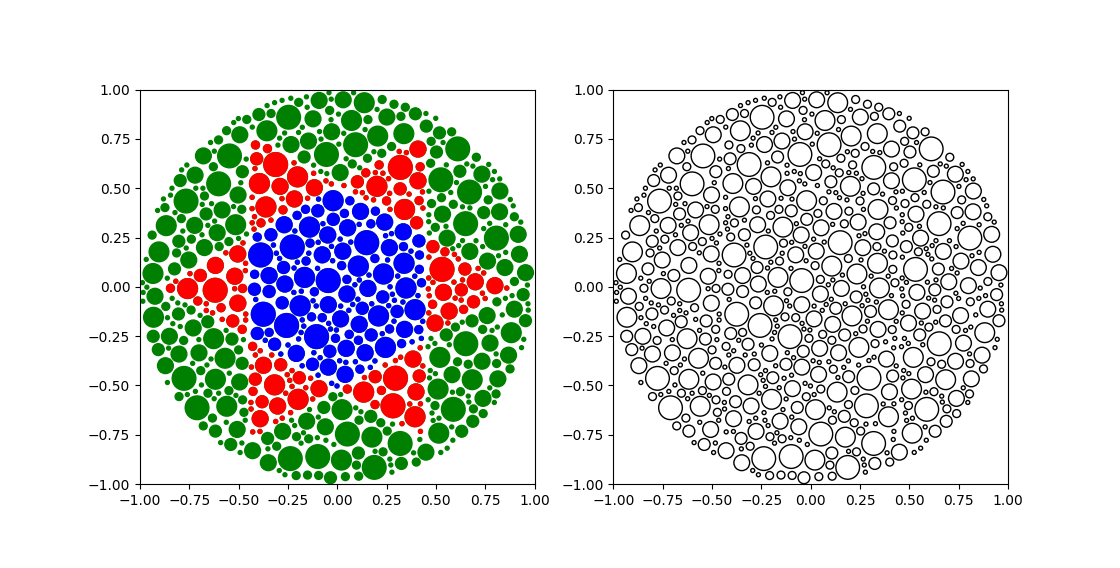
Ishihara Test plates generated using Monte Carlo procedures
It uses a circle intersection algorithm, Jordan's curve theorem, and Monte Carlo placement to create an Ishihara test (Ishihara plate). The image to be created into an Ishihara plate must be an array of points in cartesian coordinates ordered such that the shape is generated in a clockwise fashion. It is assumed that the points are joined by straight lines, and not spline curves (which greatly complicates the mathematics). It is often easiest to increase the number of points in order to best represent the curves, which can usually be done with a vector graphics software (inkscape, etc.).
example code:
import ishiharaMC, scipy
angles = scipy.linspace(0,scipy.pi*2,4)[:3] #don't make the last and first points the same
v = .9
shape1 = scipy.array([v*scipy.cos(angles),v*scipy.sin(angles)]).T
angles += scipy.pi/3
shape2 = scipy.array([v*scipy.cos(angles),v*scipy.sin(angles)]).T
inp = (shape1,shape2)
output = scipy.array(ishiharaMC.createPlate(inp))
idx1 = scipy.logical_xor(ishiharaMC.circinPoly(inp[0],output),ishiharaMC.circinPoly(inp[1],output))
idx2 = scipy.logical_and(ishiharaMC.circinPoly(inp[0],output),ishiharaMC.circinPoly(inp[1],output))
To do simple plotting:
import matplotlib.pyplot as plt
plt.subplot(121)
ishiharaMC.plotIshi(output,color='g')
ishiharaMC.plotIshi(output[idx1],color='r')
ishiharaMC.plotIshi(output[idx2],color='b')
plt.subplot(122)
ishiharaMC.plotIshi(output)
plt.show()
This should make a 6 pointed star
There is some functionality for setting the paint scheme, but generally logic based off the various objects should be known. Depending on the color scheme, it could be 2 sets of 2 colors, 2 sets of 3 colors, etc.
Additional information on the logic of the code can be found at my website: http://ianfaust.com/2016/02/19/Ishihara/
