LabPlot is a KDE-application for interactive graphing and analysis of scientific data. LabPlot provides an easy way to create, manage and edit plots and to perform data analysis.
Visit our Homepage for more details.
The most current stable version is avaible in the download section of our homepage.
If you want to see the current state of the project or to follow the development, checkout our git repository: git clone git://anongit.kde.org/labplot
If you're interested in following the development of the project or would like to contribute, visit https://labplot.kde.org/contribute/.
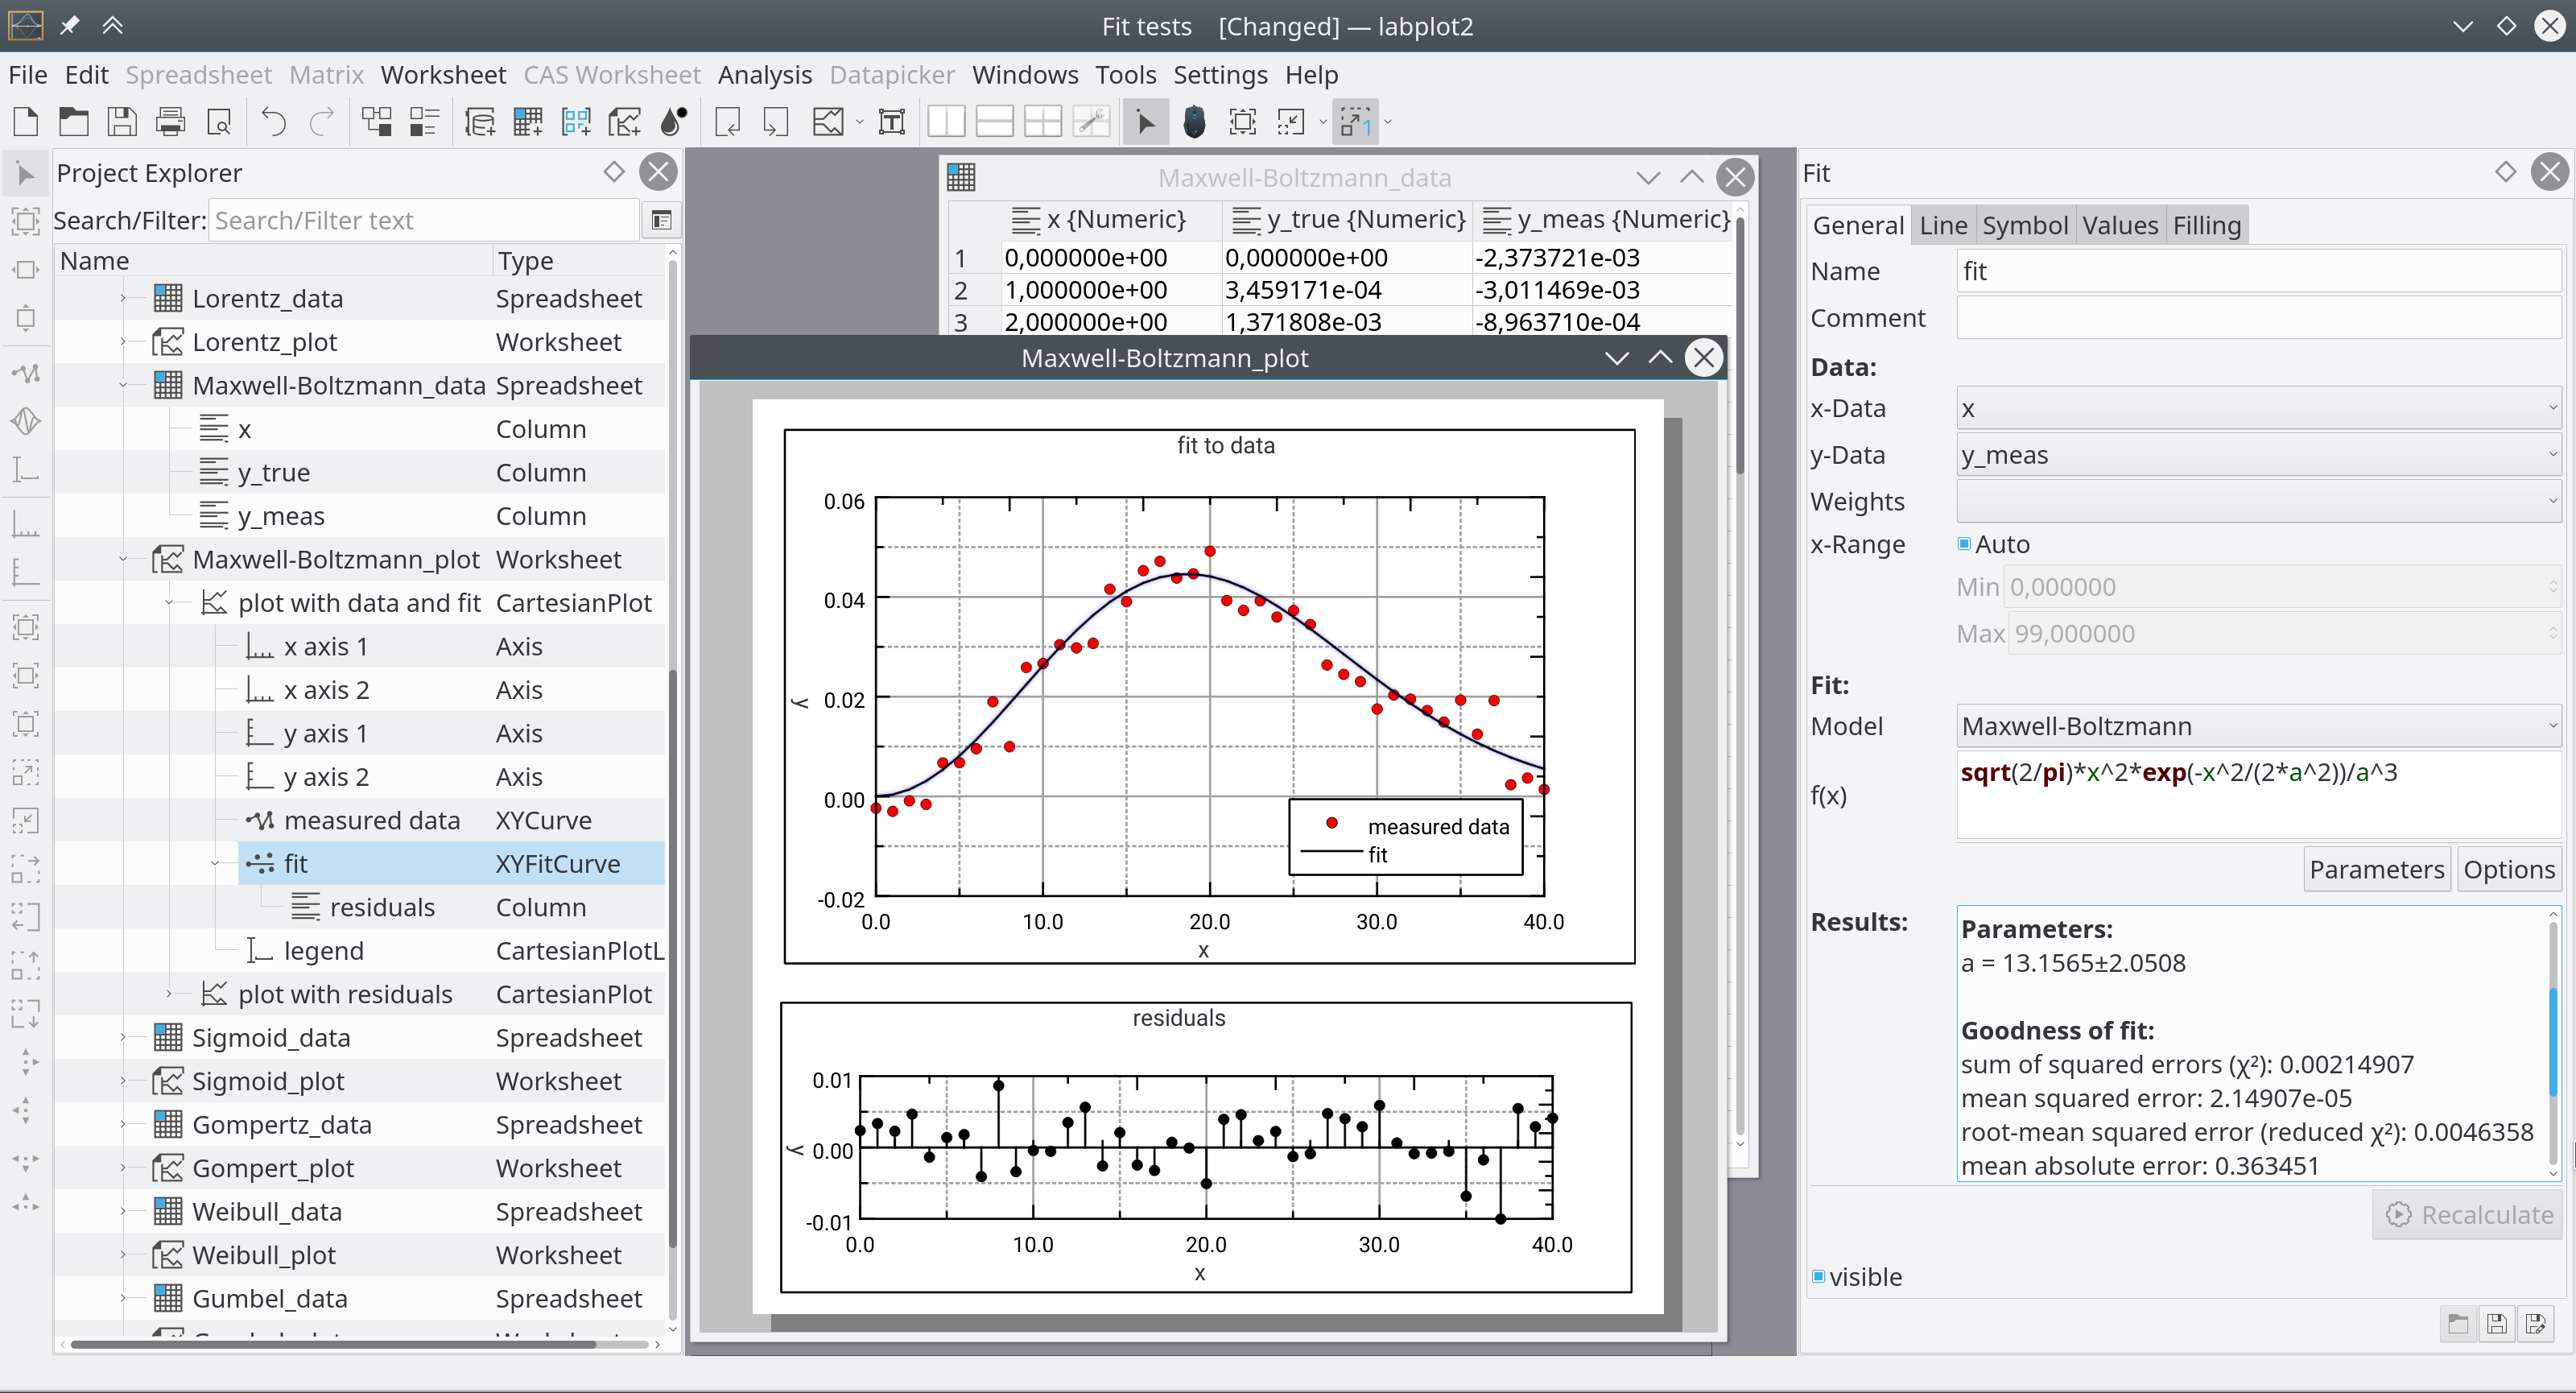
Main window of LabPlot showing the application in action:
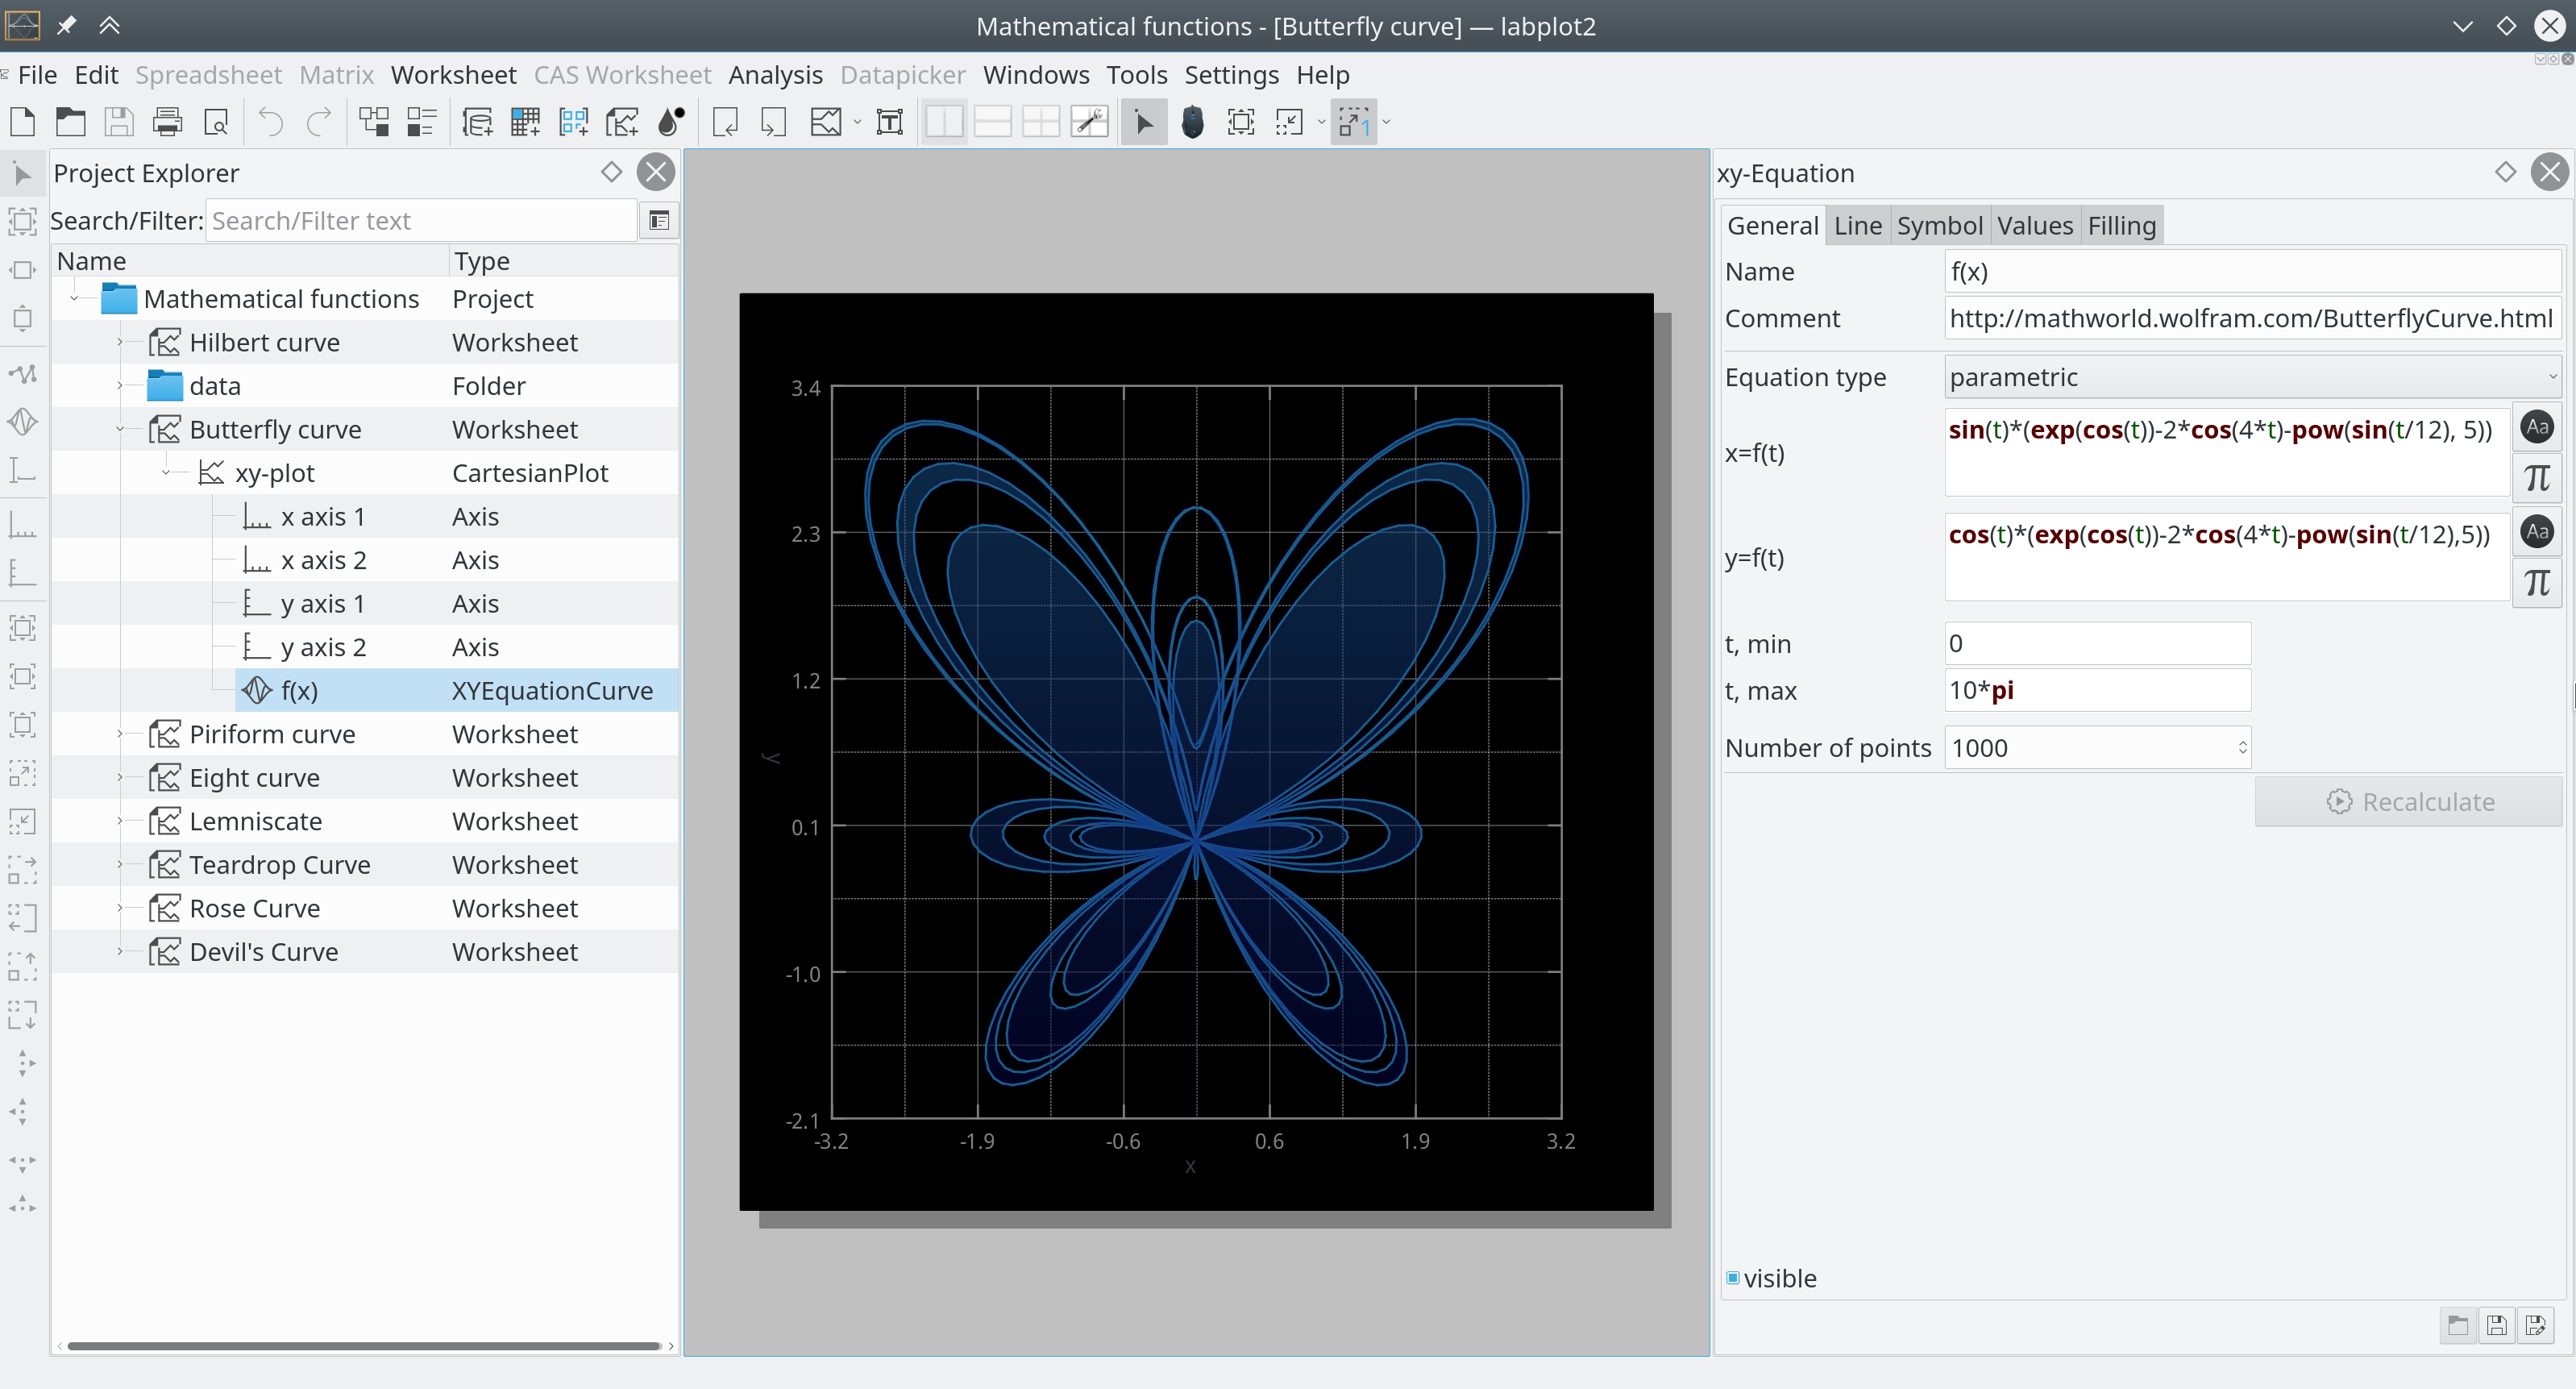
Plotting of mathematical functions:
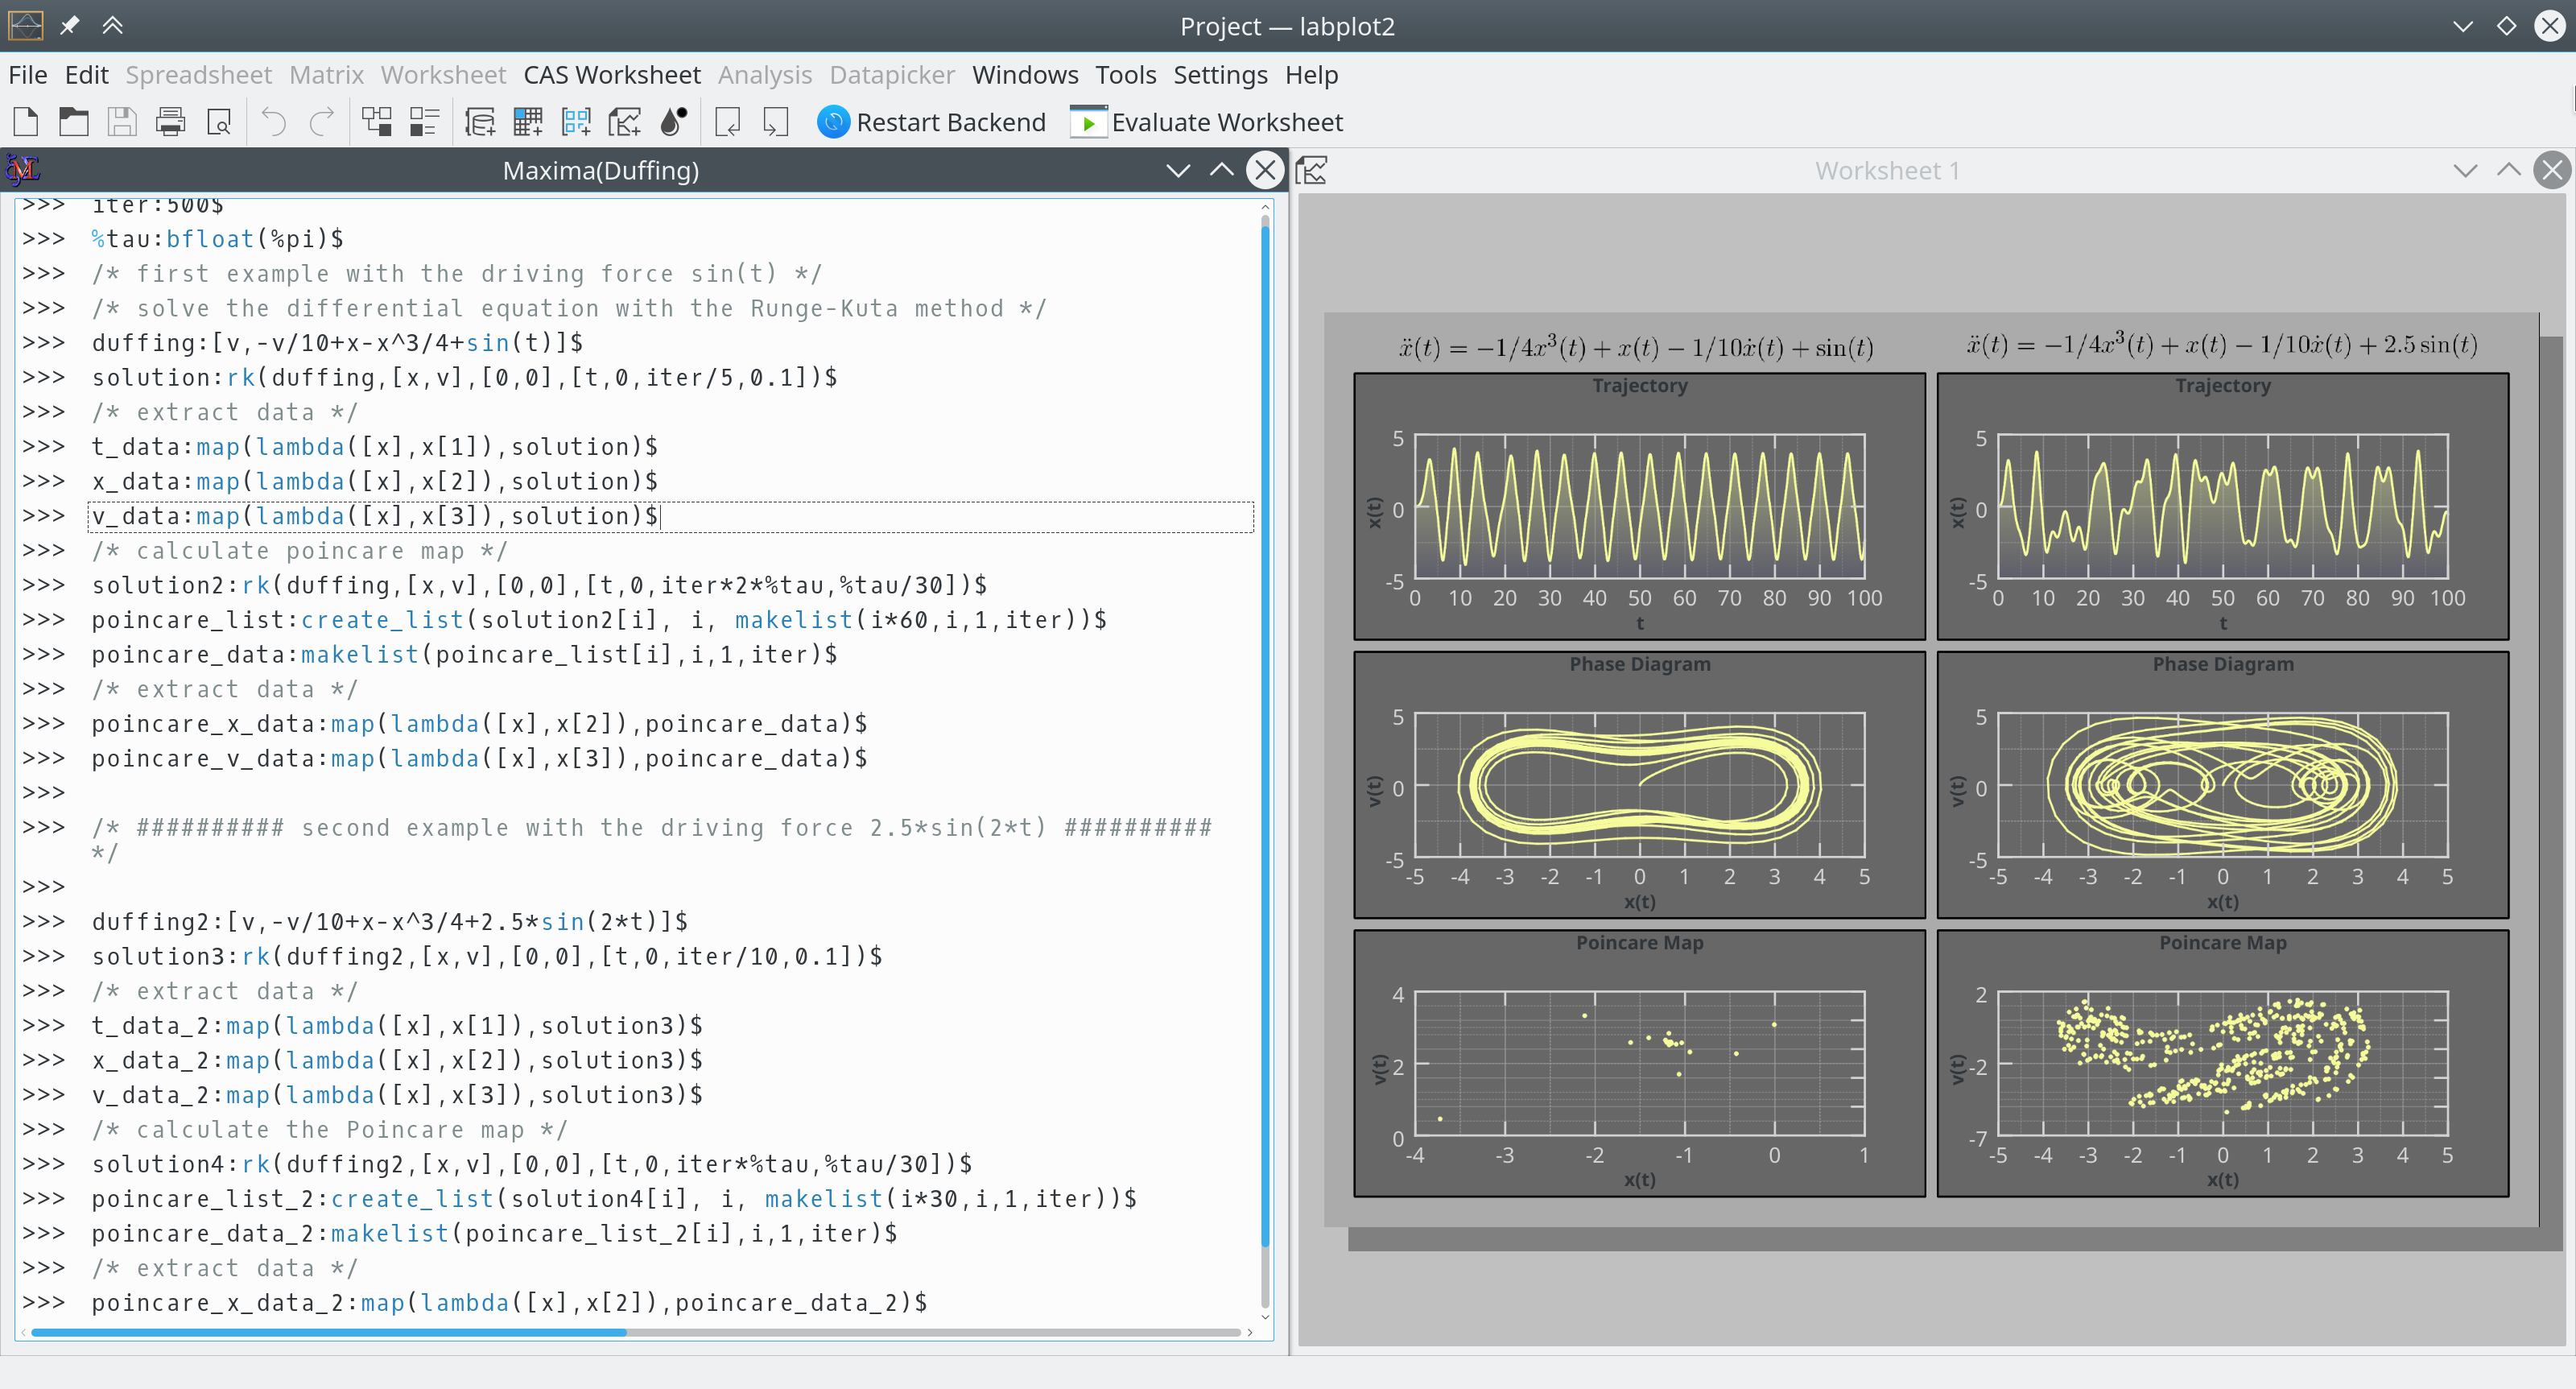
LabPlot provides support for open-source computer algebra systems and scientific languages like Maxima, Octave, R, etc. and allows to plot the data calculated in these systems/languages:
For more screenshots, see the gallery on our homepage.
Please see the INSTALL file for installation details.
Use KDE Bugtracking System to report any kind of issues with LabPlot.


