-
Notifications
You must be signed in to change notification settings - Fork 7
New issue
Have a question about this project? Sign up for a free GitHub account to open an issue and contact its maintainers and the community.
By clicking “Sign up for GitHub”, you agree to our terms of service and privacy statement. We’ll occasionally send you account related emails.
Already on GitHub? Sign in to your account
Modify Industry Sector Ratios #293
base: main
Are you sure you want to change the base?
Conversation
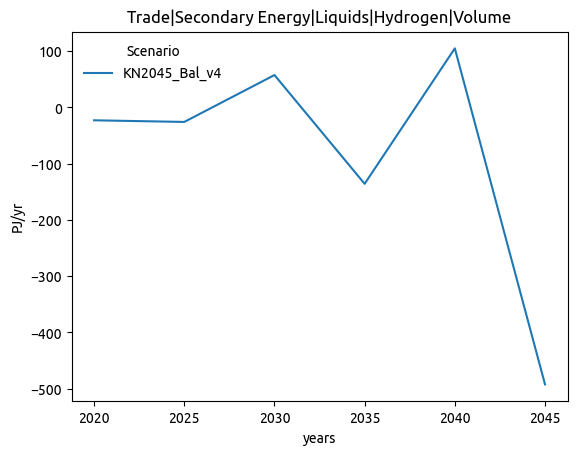
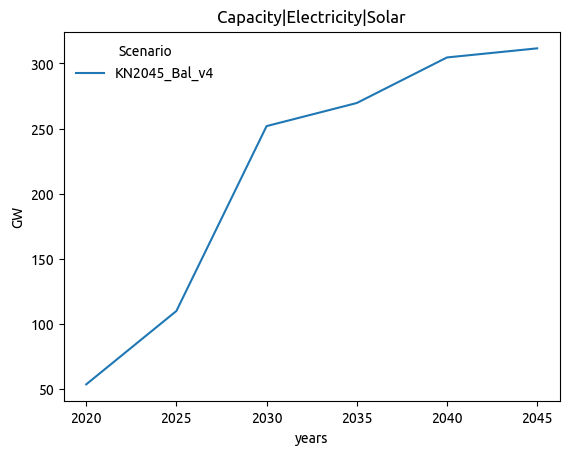
Validator ReportI am the Validator. Download all artifacts here.
|
| NRMSE | Pearson | |
|---|---|---|
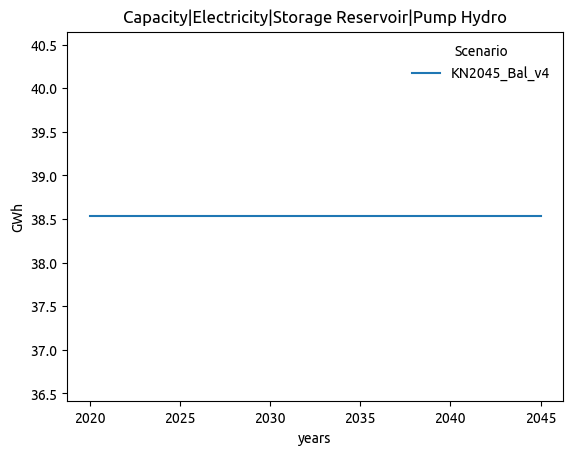
| Capacity|Electricity|Storage Reservoir|Pump Hydro | 1.000 | 0.000 |
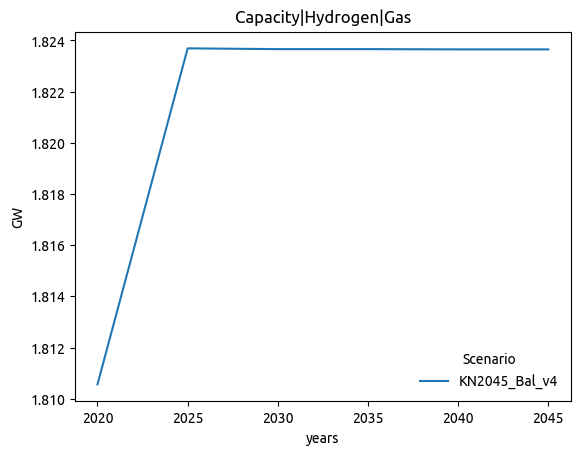
| Capacity|Hydrogen|Gas | 0.807 | 0.975 |
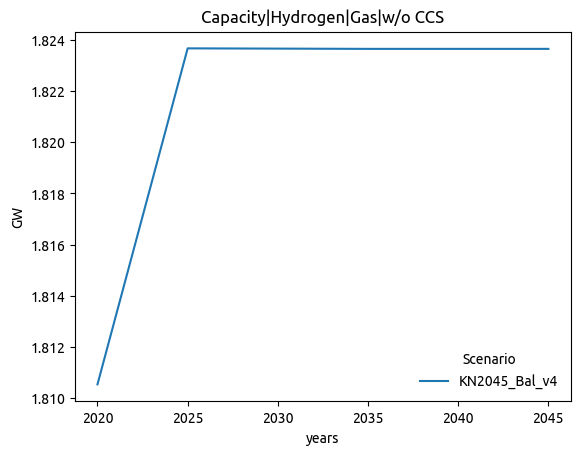
| Capacity|Hydrogen|Gas|w/o CCS | 0.806 | 0.975 |
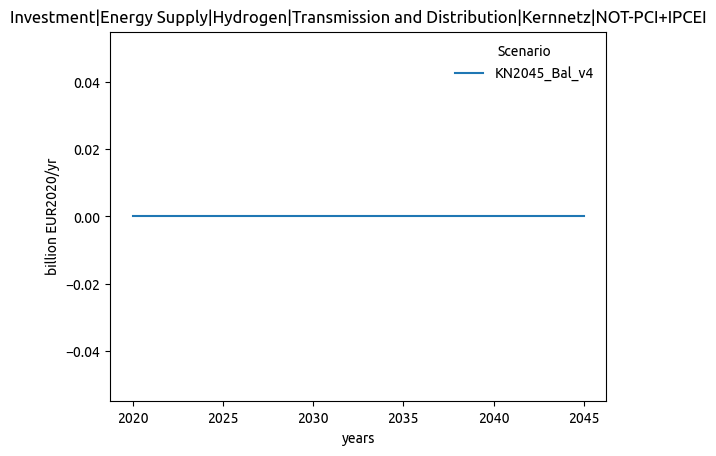
| Investment|Energy Supply|Hydrogen|Transmission and Distribution|Kernnetz|NOT-PCI+IPCEI | 0.577 | 0.000 |
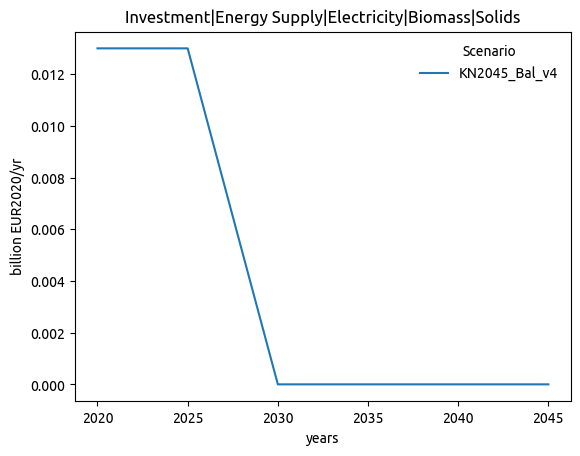
| Investment|Energy Supply|Electricity|Biomass|Solids | 0.544 | 1.000 |
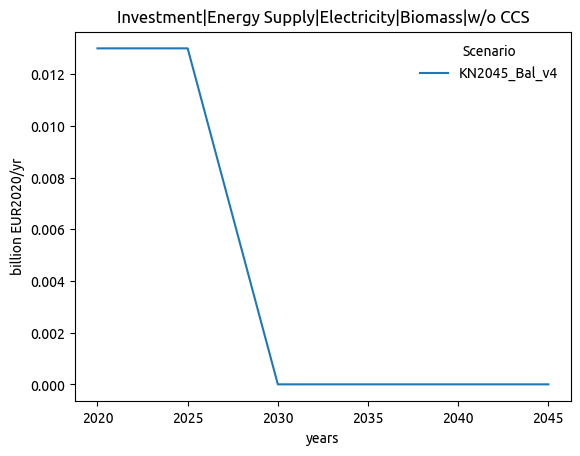
| Investment|Energy Supply|Electricity|Biomass|w/o CCS | 0.544 | 1.000 |
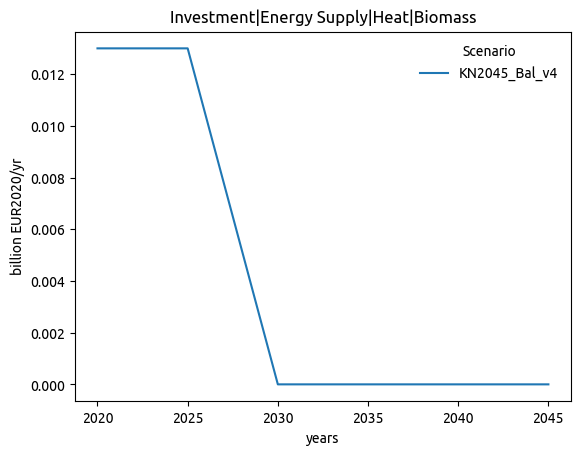
| Investment|Energy Supply|Heat|Biomass | 0.544 | 1.000 |
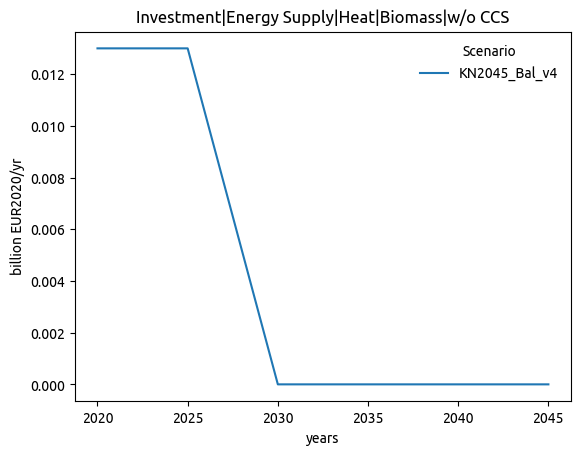
| Investment|Energy Supply|Heat|Biomass|w/o CCS | 0.544 | 1.000 |
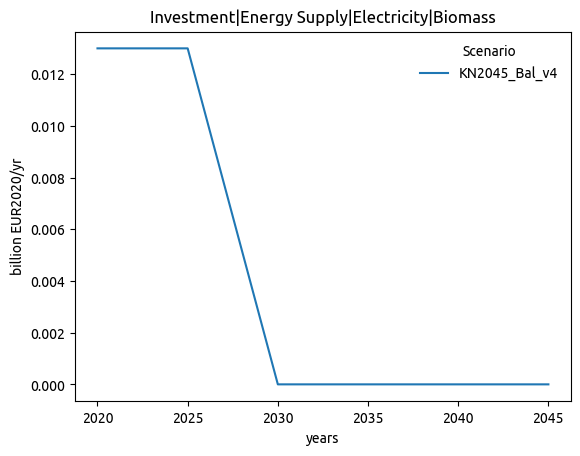
| Investment|Energy Supply|Electricity|Biomass | 0.544 | 1.000 |
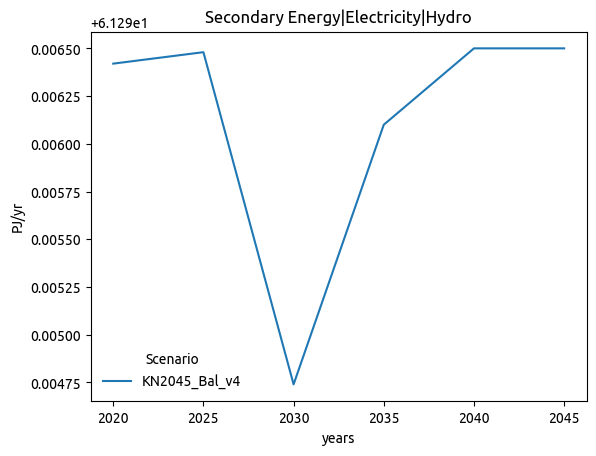
| Secondary Energy|Electricity|Hydro | 0.458 | 0.502 |
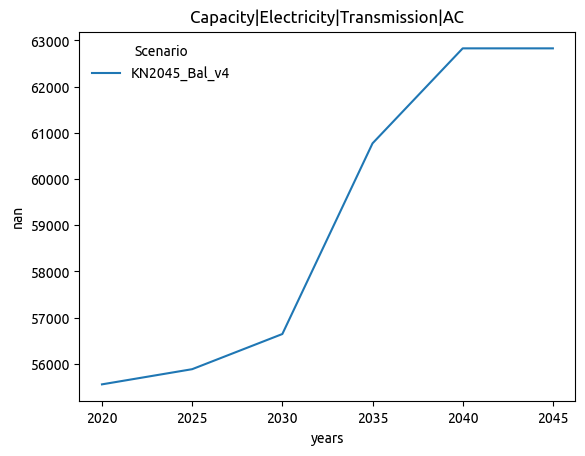
| Capacity|Electricity|Transmission|AC | 0.431 | 0.967 |
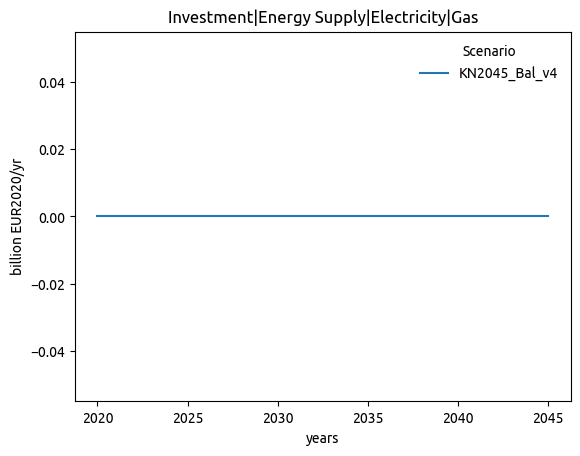
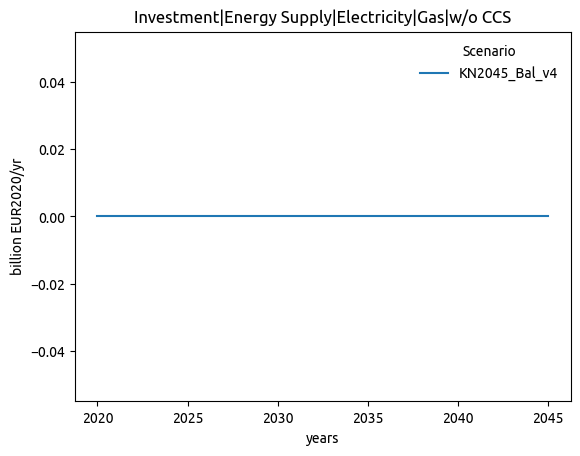
| Investment|Energy Supply|Electricity|Gas | 0.408 | 0.000 |
| Investment|Energy Supply|Electricity|Gas|w/o CCS | 0.408 | 0.000 |
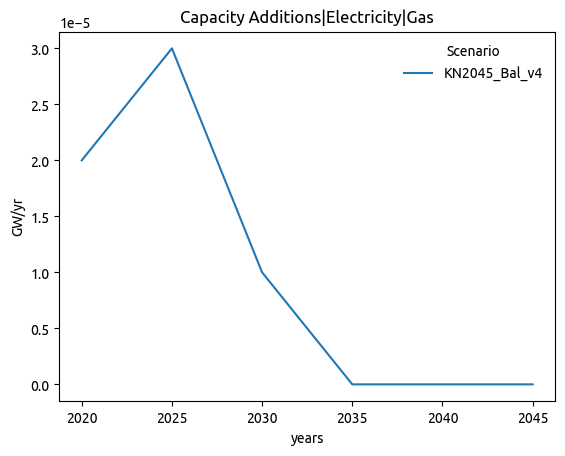
| Capacity Additions|Electricity|Gas | 0.408 | 0.388 |
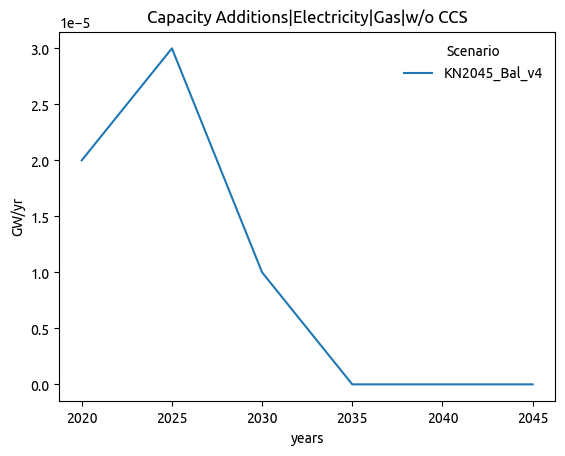
| Capacity Additions|Electricity|Gas|w/o CCS | 0.408 | 0.387 |
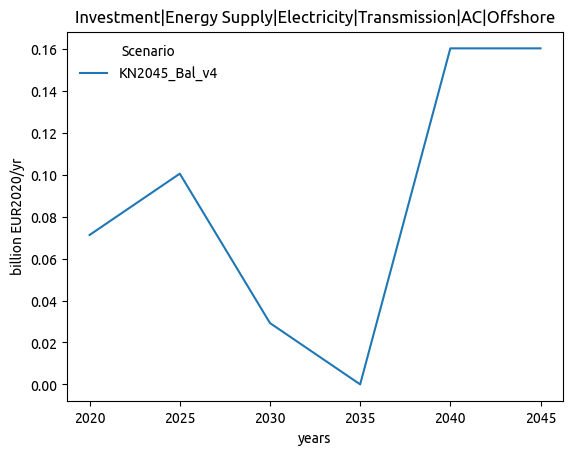
| Investment|Energy Supply|Electricity|Transmission|AC|Offshore | 0.407 | 0.353 |
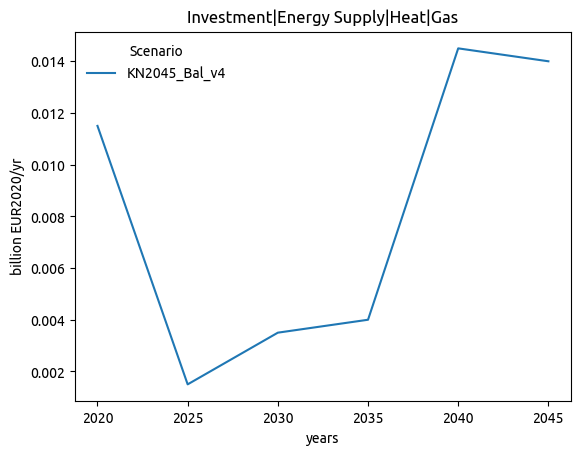
| Investment|Energy Supply|Heat|Gas | 0.406 | 0.217 |
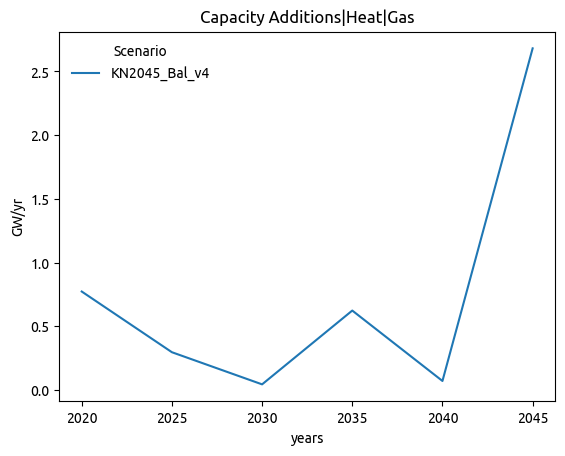
| Capacity Additions|Heat|Gas | 0.404 | 0.210 |
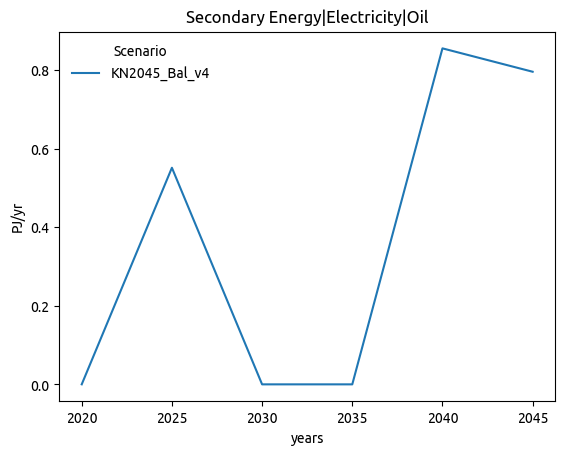
| Secondary Energy|Electricity|Oil | 0.386 | 0.687 |
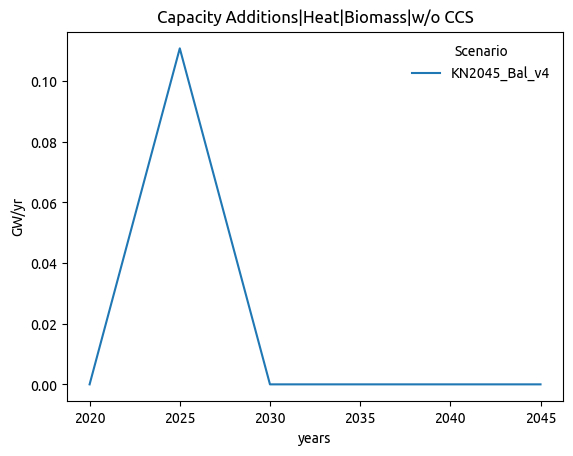
| Capacity Additions|Heat|Biomass|w/o CCS | 0.385 | 1.000 |
| Capacity Additions|Electricity|Biomass|Solids | 0.385 | 1.000 |
| Capacity Additions|Electricity|Biomass | 0.385 | 1.000 |
| Capacity Additions|Electricity|Biomass|w/o CCS | 0.385 | 1.000 |
| Capacity Additions|Heat|Biomass | 0.385 | 1.000 |
| Price|Primary Energy|Oil | 0.381 | 0.000 |
| Price|Secondary Energy|Liquids|Hydrogen | 0.375 | 0.342 |
| Secondary Energy|Heat|Oil | 0.371 | 0.663 |
| Price|Final Energy|Industry|Solids|Coal | 0.370 | 0.000 |
| Primary Energy|Oil|Heat | 0.368 | 0.466 |
| Capacity|Electricity|Storage Converter | 0.362 | 0.558 |
| Investment|Energy Supply|Electricity|Transmission|AC|NEP|Onshore | 0.343 | 0.852 |
| Length Additions|Electricity|Transmission|AC|NEP | 0.337 | 0.735 |
| Capacity Additions|Electricity|Transmission|AC|NEP | 0.337 | 0.735 |
| Length Additions|Electricity|Transmission|AC | 0.337 | 0.606 |
| Capacity Additions|Electricity|Transmission|AC | 0.337 | 0.606 |
| Price|Secondary Energy|Gases|Hydrogen | 0.335 | 0.000 |
| Capacity|Electricity|Transmission|AC|NEP | 0.331 | 0.749 |
| Capacity|Electricity|Gas|OC | 0.329 | 0.908 |
| Investment|Energy Supply|Electricity|Transmission|AC|Onshore | 0.327 | 0.880 |
| Investment|Energy Supply|Hydrogen|Transmission and Distribution|Endogen|New-build | 0.317 | 0.849 |
| Investment|Energy Supply|Electricity|Solar|PV|Open Field | 0.275 | 0.760 |
| Capacity|Electricity|Transmission | 0.272 | 0.995 |
| Final Energy|Carbon Dioxide Removal|Electricity | 0.271 | 1.000 |
| Carbon Sequestration|DACCS | 0.270 | 1.000 |
| Capacity Additions|Methanol | 0.258 | 0.716 |
| Final Energy|Industry excl Non-Energy Use|Liquids|Efuel | 0.251 | 0.947 |
| Capacity Additions|Electricity|Solar|PV|Open Field | 0.250 | 0.805 |
| Capacity|Heat|Non-Renewable Waste | 0.249 | 0.999 |
| Capacity|Electricity|Non-Renewable Waste | 0.248 | 0.999 |
| Investment|Energy Supply|Electricity|Transmission|DC|Offshore | 0.235 | 0.811 |
| Capacity|Heat|Gas | 0.233 | 0.986 |
| Final Energy|Carbon Dioxide Removal | 0.232 | 1.000 |
| Secondary Energy|Hydrogen | 0.229 | 0.900 |
| Investment|Energy Supply|Electricity|Wind|Offshore | 0.228 | 0.810 |
| Investment|Energy Supply|Electricity|Wind Offshore | 0.228 | 0.810 |
| Investment|Energy Supply|Hydrogen|Transmission and Distribution|Endogen | 0.223 | 0.938 |
| Investment|Energy Supply|Electricity|Transmission|AC|Übernahme|Startnetz Delta | 0.223 | 1.000 |
| Capacity|Hydrogen|Electricity | 0.220 | 0.981 |
| Secondary Energy|Heat|Hydrogen | 0.212 | 0.997 |
| Secondary Energy Input|Hydrogen|Heat | 0.212 | 0.997 |
| Secondary Energy|Electricity|Hydrogen | 0.212 | 0.997 |
| Secondary Energy Input|Hydrogen|Electricity | 0.212 | 0.997 |
| Secondary Energy|Hydrogen|Electricity | 0.210 | 0.955 |
| Capacity Additions|Electricity|Transmission | 0.210 | 0.875 |
| Secondary Energy Input|Electricity|Hydrogen | 0.209 | 0.960 |
| Investment|Energy Supply|Electricity|Transmission|Offshore | 0.208 | 0.838 |
| Capacity Additions|Electricity|Wind|Offshore | 0.204 | 0.834 |
| Capacity|Hydrogen | 0.203 | 0.978 |
| Investment|Energy Supply|Methanol | 0.201 | 0.863 |
| Capacity Additions|Liquids | 0.200 | 0.826 |
| Capacity Additions|Liquids|Hydrogen | 0.200 | 0.843 |
| Primary Energy|Hydro | 0.200 | 0.901 |
| Investment|Energy Supply|Hydrogen|Electrolysis | 0.199 | 0.976 |
| Investment|Energy Supply|Hydrogen|Electricity | 0.199 | 0.976 |
| Trade|Secondary Energy|Electricity|Gross Import|Volume | 0.199 | 0.975 |
| Capacity|Heat|Hydrogen | 0.197 | 1.000 |
| Capacity|Electricity|Hydrogen|CC | 0.197 | 1.000 |
| Capacity|Electricity|Hydrogen | 0.197 | 1.000 |
| Investment|Energy Supply|Heat|Hydrogen | 0.196 | 1.000 |
| Investment|Energy Supply|Electricity|Hydrogen|CC | 0.196 | 1.000 |
| Investment|Energy Supply|Electricity|Hydrogen | 0.196 | 1.000 |
| Secondary Energy|Heat | 0.188 | 0.837 |
| Capacity|Hydrogen|Transmission|Kernnetz | 0.188 | 0.998 |
| Trade|Secondary Energy|Methanol|Volume | 0.184 | 0.936 |
| Final Energy|Carbon Dioxide Removal|Heat | 0.184 | 1.000 |
| Secondary Energy|Electricity|Curtailment | 0.183 | 0.929 |
| Investment|Energy Supply|Hydrogen|Transmission and Distribution|Kernnetz|Retrofitted | 0.180 | 0.996 |
| Secondary Energy|Heat|Other | 0.180 | 0.981 |
| Capacity|Heat|Processes | 0.180 | 0.988 |
| Investment|Energy Supply|Hydrogen|Transmission and Distribution|Retrofitted | 0.174 | 0.993 |
| Investment|Energy Supply|Electricity|Non-Renewable Waste | 0.174 | 0.998 |
| Investment|Energy Supply|Heat|Non-Renewable Waste | 0.174 | 0.998 |
| Investment|Energy Supply|Heat|Processes | 0.172 | 0.986 |
| Final Energy|Gases|Biomass | 0.171 | 0.971 |
| Final Energy|Residential and Commercial|Gases|Biomass | 0.171 | 0.940 |
| Emissions|CO2|Efuels|Gases | 0.169 | 0.930 |
| Capacity|Electricity|Solar|PV|Open Field | 0.167 | 0.963 |
| Secondary Energy|Electricity|Storage Losses | 0.167 | 0.940 |
| Capacity|Hydrogen|Transmission | 0.163 | 0.997 |
| Primary Energy|Biomass|Solids | 0.163 | 0.850 |
| Secondary Energy|Solids|Biomass | 0.163 | 0.850 |
| Capacity|Electricity|Transmission|NEP | 0.160 | 0.973 |
| Capacity|Hydrogen|Transmission|Endogenous | 0.159 | 0.995 |
| Investment|Energy Supply|Hydrogen|Transmission and Distribution|Endogen|Retrofitted | 0.158 | 0.967 |
| Capacity Additions|Heat | 0.157 | 0.954 |
| Capacity Additions|Hydrogen | 0.156 | 0.943 |
| Capacity Additions|Electricity|Transmission|NEP | 0.155 | 0.976 |
| Secondary Energy|Electricity|Waste | 0.155 | 0.999 |
| Primary Energy|Waste|Electricity | 0.155 | 0.999 |
| Final Energy|Waste | 0.155 | 0.999 |
| Primary Energy|Waste | 0.155 | 0.999 |
| Secondary Energy|Heat|Waste | 0.155 | 0.999 |
| Primary Energy|Waste|Heat | 0.155 | 0.999 |
| Capacity Additions|Hydrogen|Electricity | 0.154 | 0.952 |
| Capacity Additions|Hydrogen|Transmission|Endogenous | 0.154 | 0.968 |
| Final Energy|Industry excl Non-Energy Use|Gases|Biomass | 0.152 | 0.992 |
| Capacity|Heat | 0.152 | 0.988 |
| Secondary Energy|Electricity|Biomass|Solid | 0.150 | 0.999 |
| Secondary Energy|Electricity|Biomass | 0.149 | 0.984 |
| Secondary Energy|Electricity|Biomass|w/o CCS | 0.149 | 0.984 |
| Capacity Additions|Heat|Processes | 0.148 | 0.969 |
| Secondary Energy Input|Electricity|Liquids | 0.147 | 0.956 |
| Secondary Energy|Methanol | 0.147 | 0.956 |
| Investment|Energy Supply|Liquids|Hydrogen | 0.145 | 0.924 |
| Final Energy|Industry excl Non-Energy Use|Liquids|Biomass | 0.144 | 0.942 |
| Secondary Energy|Heat|Gas | 0.144 | 0.989 |
| Final Energy|Solids|Biomass | 0.144 | 0.888 |
| Capacity|Methanol | 0.141 | 0.956 |
| Final Energy|Liquids|Efuel | 0.140 | 0.982 |
| Capacity Additions|Heat|Hydrogen | 0.139 | 1.000 |
| Capacity Additions|Electricity|Hydrogen|CC | 0.139 | 1.000 |
| Capacity Additions|Electricity|Hydrogen | 0.139 | 1.000 |
| Capacity Additions|Heat|Storage Reservoir | 0.135 | 0.954 |
| Capacity Additions|Electricity|Solar|PV | 0.133 | 0.927 |
| Capacity Additions|Electricity|Solar | 0.133 | 0.927 |
| Final Energy|Transportation|Liquids|Efuel | 0.132 | 0.983 |
| Investment|Energy Supply|Heat|Storage Reservoir | 0.130 | 0.972 |
| Capacity Additions|Electricity|Wind|Onshore | 0.129 | 0.922 |
| Investment|Energy Supply|Hydrogen|Transmission and Distribution|Kernnetz | 0.129 | 0.998 |
| Length Additions|Electricity|Transmission | 0.127 | 0.963 |
| Capacity Additions|Electricity|Non-Renewable Waste | 0.123 | 0.997 |
| Capacity Additions|Heat|Non-Renewable Waste | 0.123 | 0.997 |
| Final Energy|Heat | 0.123 | 0.977 |
| Secondary Energy|Heat|Biomass | 0.120 | 0.996 |
| Investment|Energy Supply|Electricity|Transmission|DC | 0.119 | 0.952 |
| Capacity|Heat|Storage Reservoir | 0.119 | 0.991 |
| Capacity|Heat|Storage Converter | 0.117 | 0.988 |
| Capacity Additions|Heat|Storage Converter | 0.117 | 0.988 |
| Secondary Energy|Heat|Electricity|Resistive | 0.116 | 0.975 |
| Investment|Energy Supply|Hydrogen|Transmission and Distribution|Kernnetz|IPCEI | 0.116 | 1.000 |
| Investment|Energy Supply|Liquids | 0.115 | 0.951 |
| Investment|Energy Supply|Electricity|Wind Onshore | 0.115 | 0.951 |
| Investment|Energy Supply|Electricity|Wind|Onshore | 0.115 | 0.951 |
| Investment|Energy Supply|Hydrogen|Transmission and Distribution|Kernnetz|PCI | 0.115 | 0.998 |
| Secondary Energy|Liquids|Hydrogen | 0.114 | 0.976 |
| Investment|Energy Supply|Hydrogen|Transmission and Distribution|Kernnetz|PCI+IPCEI | 0.113 | 0.998 |
| Secondary Energy Input|Hydrogen|Liquids | 0.112 | 0.978 |
| Emissions|CO2|Model|CCU | 0.112 | 0.971 |
| Trade|Primary Energy|Biomass|Volume | 0.111 | 0.991 |
| Investment|Energy Supply|Hydrogen|Transmission and Distribution | 0.110 | 0.997 |
| Investment|Energy Supply|Hydrogen|Transmission | 0.110 | 0.997 |
| Primary Energy|Biomass|Heat | 0.108 | 0.995 |
| Final Energy|Residential and Commercial|Solids|Biomass | 0.107 | 0.940 |
| Final Energy|Residential and Commercial|Solids | 0.107 | 0.940 |
| Primary Energy|Gas|Heat | 0.106 | 0.991 |
| Final Energy|Industry excl Non-Energy Use | 0.106 | 0.986 |
| Investment|Energy Supply|Electricity|Transmission|AC | 0.106 | 0.988 |
| Secondary Energy|Electricity|Coal|Hard Coal | 0.105 | 1.000 |
| Investment|Energy Supply|Hydrogen | 0.105 | 0.996 |
| Investment|Energy Supply|Heat|Resistive heater | 0.104 | 0.977 |
| Primary Energy|Oil|Electricity | 0.104 | 0.965 |
NRMSE: Normalized (combined-min-max) Root Mean Square Error
Pearson: Pearson correlation coefficient
Threshold: NRMSE > 0.1
Only variables reaching the threshold are shown. Find the equivalent plot for all of them below.
Plots
| Main branch | Feature branch |
|---|---|
 |
 |
 |
 |
 |
 |
 |
 |
 |
 |
 |
 |
 |
 |
 |
 |
 |
 |
 |
 |
 |
 |
 |
 |
 |
 |
 |
 |
 |
 |
 |
 |
 |
 |
 |
 |
 |
 |
 |
 |
General
Files comparison
| Status | NRMSE | MAE (norm) | |
|---|---|---|---|
| csvs/prices.csv | 0.020 | 0.07 | |
| csvs/curtailment.csv | 0.000 | 0.13 | |
| csvs/price_statistics.csv | 0.077 | 0.13 | |
| csvs/cumulative_cost.csv | 0.001 | 0.10 | |
| csvs/metrics.csv | 0.001 | 0.09 | |
| csvs/nodal_cfs.csv | |||
| csvs/supply.csv | |||
| csvs/nodal_supply_energy.csv | |||
| csvs/capacities.csv | |||
| csvs/costs.csv | |||
| csvs/nodal_costs.csv | |||
| csvs/nodal_capacities.csv | |||
| csvs/cfs.csv | |||
| csvs/supply_energy.csv | |||
| csvs/energy.csv | |||
| csvs/market_values.csv | ✅ Almost equal | 0.096 | 0.04 |
| csvs/weighted_prices.csv | ✅ Equal |
NRMSE: Normalized (combined-min-max) Root Mean Square Error
MAE (norm): Mean Absolute Error on normalized data (min-max)
Status Threshold: MAE (norm) > 0.05 and NRMSE > 0.3
Model Metrics
Comparing industry_sector_ratios_de (d086d39) with main (496f95e).
Branch is 4 commits ahead and 0 commits behind.
Last updated on 2024-12-03 09:11:22 CET.
There was a problem hiding this comment.
Choose a reason for hiding this comment
The reason will be displayed to describe this comment to others. Learn more.
This PR seems to a bit more complex, lets briefly discuss it via zoom / in person
| @@ -62,7 +62,7 @@ scenario: | |||
| ll: | |||
| - vopt | |||
| clusters: | |||
| - 27 #current options: 27, 49 | |||
| - 49 #current options: 27, 49 | |||
There was a problem hiding this comment.
Choose a reason for hiding this comment
The reason will be displayed to describe this comment to others. Learn more.
please revert this before merging
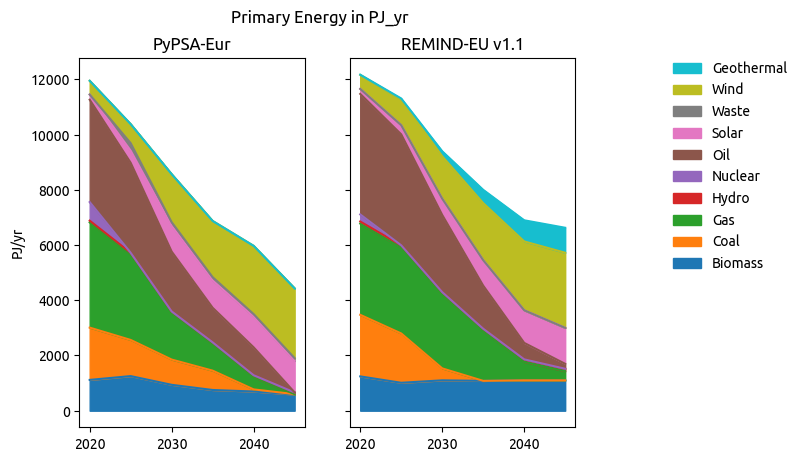

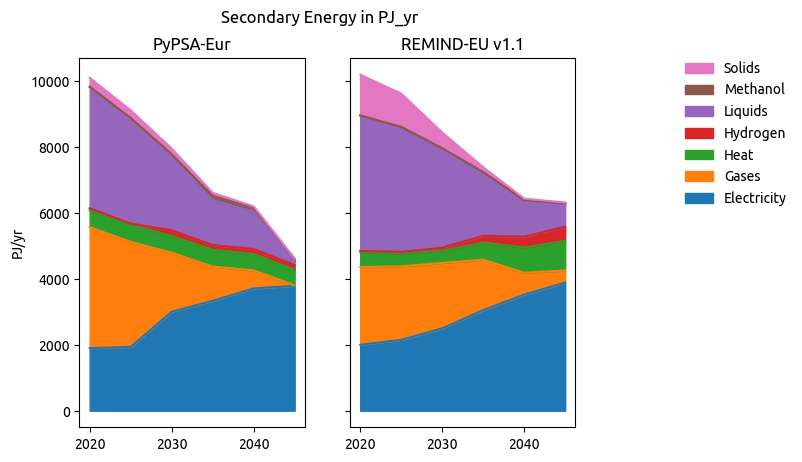

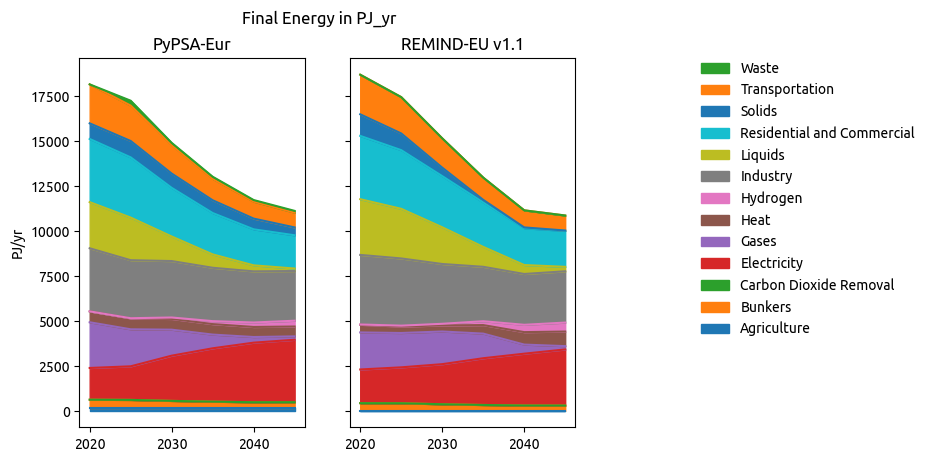

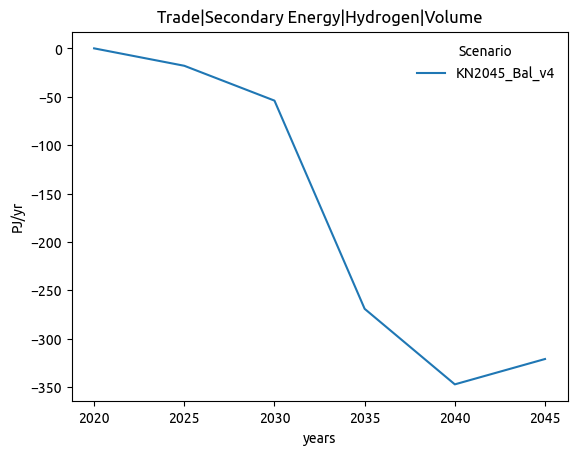




This PR allows to adjust the industry sector ratios for Germany.
A new config
config[industry][sector_ratios_fraction_future_DE]is introduced to specify the German industrial transition which will be completed in 2045.The rule
modify_sector_ratiosreads in the existing sector ratios for Europe and calculates a faster transition for Germany. The adjusted sector ratios are then written into the fileindustry_sector_ratios_{planning_horizons}-modified.csv.This modified file is fed into the pypsa-eur rule
build_industrial_energy_demand_per_nodeso the new sector ratios propagate through the entire industrial sector rules.As a result, Germany reaches net zero in the industrial sector which means that there is no more coal and coke demand by 2045.
Before asking for a review for this PR make sure to complete the following checklist:
ariadne_allcompletes without errorsexport_ariadne_variableshas been adapted to the changesnot applicable
Changelog.mdmainhas been merged into the PRYYYYMMDDdescriptive_title