Gallery
Wiki ▸ Gallery
Welcome to the D3 gallery. Feel free to add links to your work! More examples are available in the D3 repository. If you want to share an example and don't have your own hosting, consider using Gist and bl.ocks.


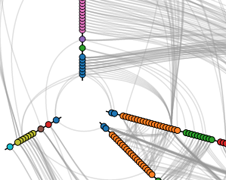


- Visualizing Networks with Hive Plots
- The Wealth & Health of Nations
- Bézier Curves, Collatz Graph, Word Cloud and many Mathematical Visualisations - Jason Davies
- Koalas to the Max! - Vadim Ogievetsky
- Urban Water Explorer - Jan Willem Tulp
- What Do You Work For? - Jeffrey Baumes
- Misc. Examples - Justin Palmer
- Collusion FireFox Addon - Atul Varma
- UK University Statistics - Keming Labs (Kevin Lynagh)
- Slopegraphs - Hamilton Ulmer
- Marmoset chimerism dotplot - David Rio Deiros
- UN Global Pulse 2010 Visualization - Eduardo Graells & Ruth Garcia
- U.S. Population Pyramid - Jeff Heer
- Lines Spent (Chrome Commits) - Evan Martin
- Transit time from my office - Beau Gunderson
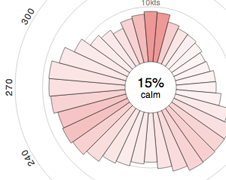
- WindHistory.com: maps and charts - Nelson Minar
- Students' seating habits - Skyrill.com
- World Wide Women's Rights - Wimdows.nl
- Old Visualizations Made New Again - Jim Vallandingham
- Scatterize - Nate Vack
- Various visualisations especially with d3.geo - Lars Kotthoff
- Global Life Expectancy - Nathan Yau (FlowingData)
- Vegetable Nutrition w/ Parallel Coordinates - Kai Chang
- London Olympics Perceptions - Donuts to Chord Diagram Transition - Kyle Foreman, Peter Hamilton, Cristina Grigoruta
- Euro Debt Crisis
- Fuzzy Link-Bot - Entity co-occurrence in music news by Andrew Collins.
- Job Flow
- Visualizing a newborn's feeding and diaper activity - Jimmie Yoo
- Inequality in America - EJ Fox for Visual.ly
- Current Article Popularity Trends on Hacker News - Vadim Ogievetsky
- AFL Brownlow Medalists, Formula 1 Lap Chart, When is Easter? and David Foster Wallace's "Infinite Jest" - Chris Pudney (VisLives!)
- Uber Rides by Neighborhood
- Les Misérables Co-occurrence
- US Elections 2012 / Twitter
- Major League Baseball Home Runs, 1995-2010 - Ken Cherven (Visual-Baseball.com)
- Color: a color matching game - Maria Munuera and Mark MacKay
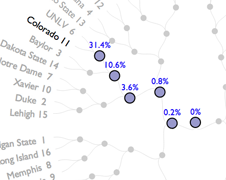
- NCAA 2012 March Madness Power Rankings - Angi Chau
- iTunes Music Library Artist/Genre Graph - Christopher Martin
- [Data Story] (http://data-story.org) - Decio Battaglia, Kevin Mahoney and Xiaoying Riley
- Four Ways to Slice Obama’s 2013 Budget Proposal - Shan Carter
- The Facebook Offering: How It Compares - Jeremy Ashkenas et al.
- A Race to Entitlement
- Visualising New Zealand's Stolen Vehicle Database Part1 and Part2
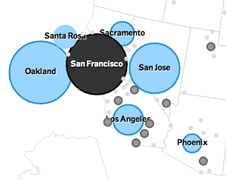
- Visualizing San Francisco Home Price Ranges
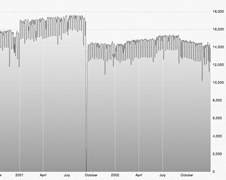
- Daily data return rates for seismic networks in the EarthScope USArray - Rob Newman, Array Network Facility, UCSD
- What Size Am I? Finding clothes that fit
- Baseball 2012 Predictions based on past 6 years - Danny Hadley
- Last Chart! - See the Music
- Axis Component
- Date Ticks
- Venn Diagram using Clipping
- Venn Diagram using Opacity
- Marimekko Chart
- Histogram Chart
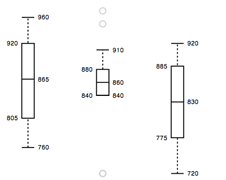
- Fixed-width Histogram
- Variable-width Histogram
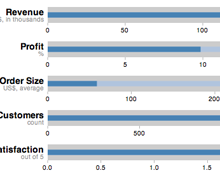
- Grouped Bar Chart (alternative example)
- Stacked Bar Chart
- Reorderable Stacked Bar Chart
- Small Multiples
- Pie Multiples / Pie Multiples with Nesting
- Pie Chart Updating (Part 1) (Part 2)
- Sparklines
- Line charts
- Interactive Line Graph
- Scatterplot and Heatmap
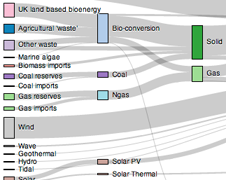
- Animated Sankey Diagram (alluvial)
- Parallel Coordinates
- Parallel Sets
- Horizon Chart
- Gauge
- Line Chart with tooltips
- Chernoff faces
- Swimlane Chart
- Stacked layout with time axis
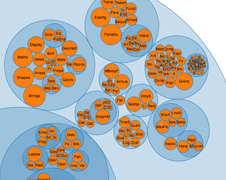
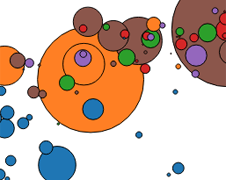
- Animated bubble charts for school data analysis
- Pictograms
- Scatterplot for K-Means clustering visualization
- Dependency Chord Diagram
- Chord Layout Transitions
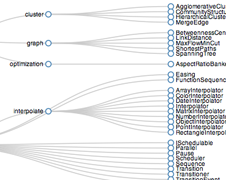
- Hierarchical Edge Bundling
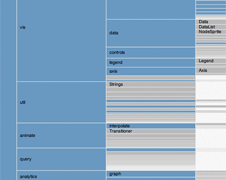
- Hierarchical Bar Chart
- Partition Layout (Zoomable Icicle)
- Tree Layout (Animated)
- Tree Layout (Collapsible)
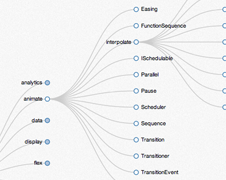
- Tree Layout (Collapsible, with Labels)
- Treemap Layout in SVG
- Sunburst Layout with Labels
- Sunburst: Coffee Flavour Wheel
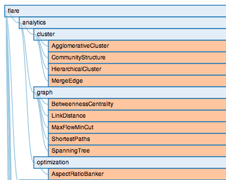
- Indented Tree (Collapsible)
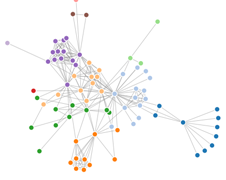
- Force Layout with Symbols
- Force Layout with Custom Forces
- Force Layout with Multiple Foci
- Force Layout with Images and Labels
- Force Layout with drag and drop support to set nodes to fixed position when dropped
- Force Layout (Interactive Construction)
- Force Layout (Collapsible Hierarchy)
- Force Layout from XML
- Force Layout from Matrix Market format
- Force Layout with Directed Edges (Curves and Arrow Markers)
- Bounded Force Layout
- Building a tree diagram
- Reveal animation on a tree with a clip path
- Force-Based Label Placement
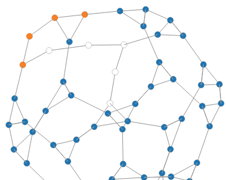
- Visualizing a network with Cypher and d3.js
- Connections in time
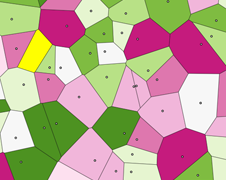
- Voronoi Diagram with Force Directed Nodes and Delaunay Links
- Building Cubic Hamiltonian Graphs from LCF Notation
- Chicago Lobbyists Force-Directed Graph Visualization
- Circular tree. Will your team win the NCAA Tournament?
- Bracket Layout
- Force Layout with Groups and Labels showing relations of football players participating in Euro 2012
- Superformula Explorer
- Superformula Tweening
- OMG Particles!
- Line Tension
- Segmented Lines and Slope Coloring
- Raindrops
- Linear Gradients
- Force Directed States of America
- Rounded Rectangles
- Spermatozoa
- Spline, Zoom and Pan
- Arc Tweens
- Show Reel
- VVVV viewer
- Merge Sort
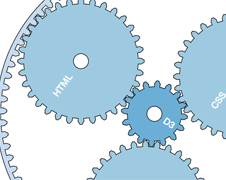
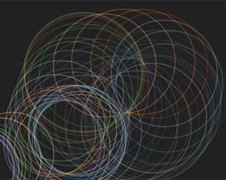
- Epicyclic Gearing
- DOM-to-Canvas
- Transform Transitions
- Square Circle Spiral Illusion
- Adventures in D3
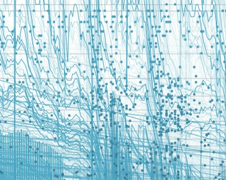
- Time Series
- Voronoi-based point picker
- Radar chart
- Drag rectangle
- Elastic collisions(http://bl.ocks.org/1706849)
- Collider - a d3.js game
- alpha-shapes aka concave hulls
- Conway's Game of life as a scrolling background
- Masking with external svg elements
- PJAX
- Table Sorting
- Canvas with d3 and Underscore
- Automatically sizing text
- SVG to Canvas
- d3 rendered with RaphaelJS for IE Compatibility
- Templating ala Mustache, with Chernoff faces example
- Bay Area earthquake responses by zip code: loading external file through Yahoo Pipes
- Click-to-Zoom with Albers Projection
- Google Maps
- Polymaps
- Polymaps with custom tiler
- Map from GeoJSON data with zoom/pan
- Maps and sound
- Choropleth classification systems
- Choropleth with interactive parameters for NYC data visualization, code
- Mercator and Albers to Orthographic Projection
- Non-Contiguous Cartogram
- Flows of refugees between the world countries in 2008
- IPython-Notebook with d3.js
- Plotting library for python based on d3
- Visualizing NetworkX graphs in the browser using D3
- Pushing d3 commands to the browser from iPython
- Dance.js: D3 with Backbone and Data.js
- Backbone-D3
- Viewing OpenLearn Mindmaps Using d3.js
- Splay Tree animation with dart, d3, and local storage
- Sankey diagrams from Excel
- Live coding based on Bret Victor's Inventing on Principle talk
- The same but with Gist integration
- Project Archon
- D3.js playground
- D3.js sandbox
- Cube: Time Series Data Collection & Analysis
- Fast Multidimensional Filtering for Coordinated Views
- Polychart: A browser-based platform for exploring data and creating charts
- Plot.io: Data Visualization made Fast, Fun and Easy
- Chart.io: The Easiest Business Dashboard You'll Ever Use
- Trisul Network Analytic
- Explore Analytics: cloud-based data analytics and visualization
- Meshu turns your places into beautiful objects.
- Cubism.js: Time Series Visualization
- Rickshaw: JavaScript toolkit for creating interactive real-time graphs
- Dynamic Visualization LEGO
- arc diagram
- polar area diagram (nightingale)
- gantt, other timelines and timing diagram
- sankey diagram
- candlestick or ohlc
- fibonacci scale
- data table
- hypergraph