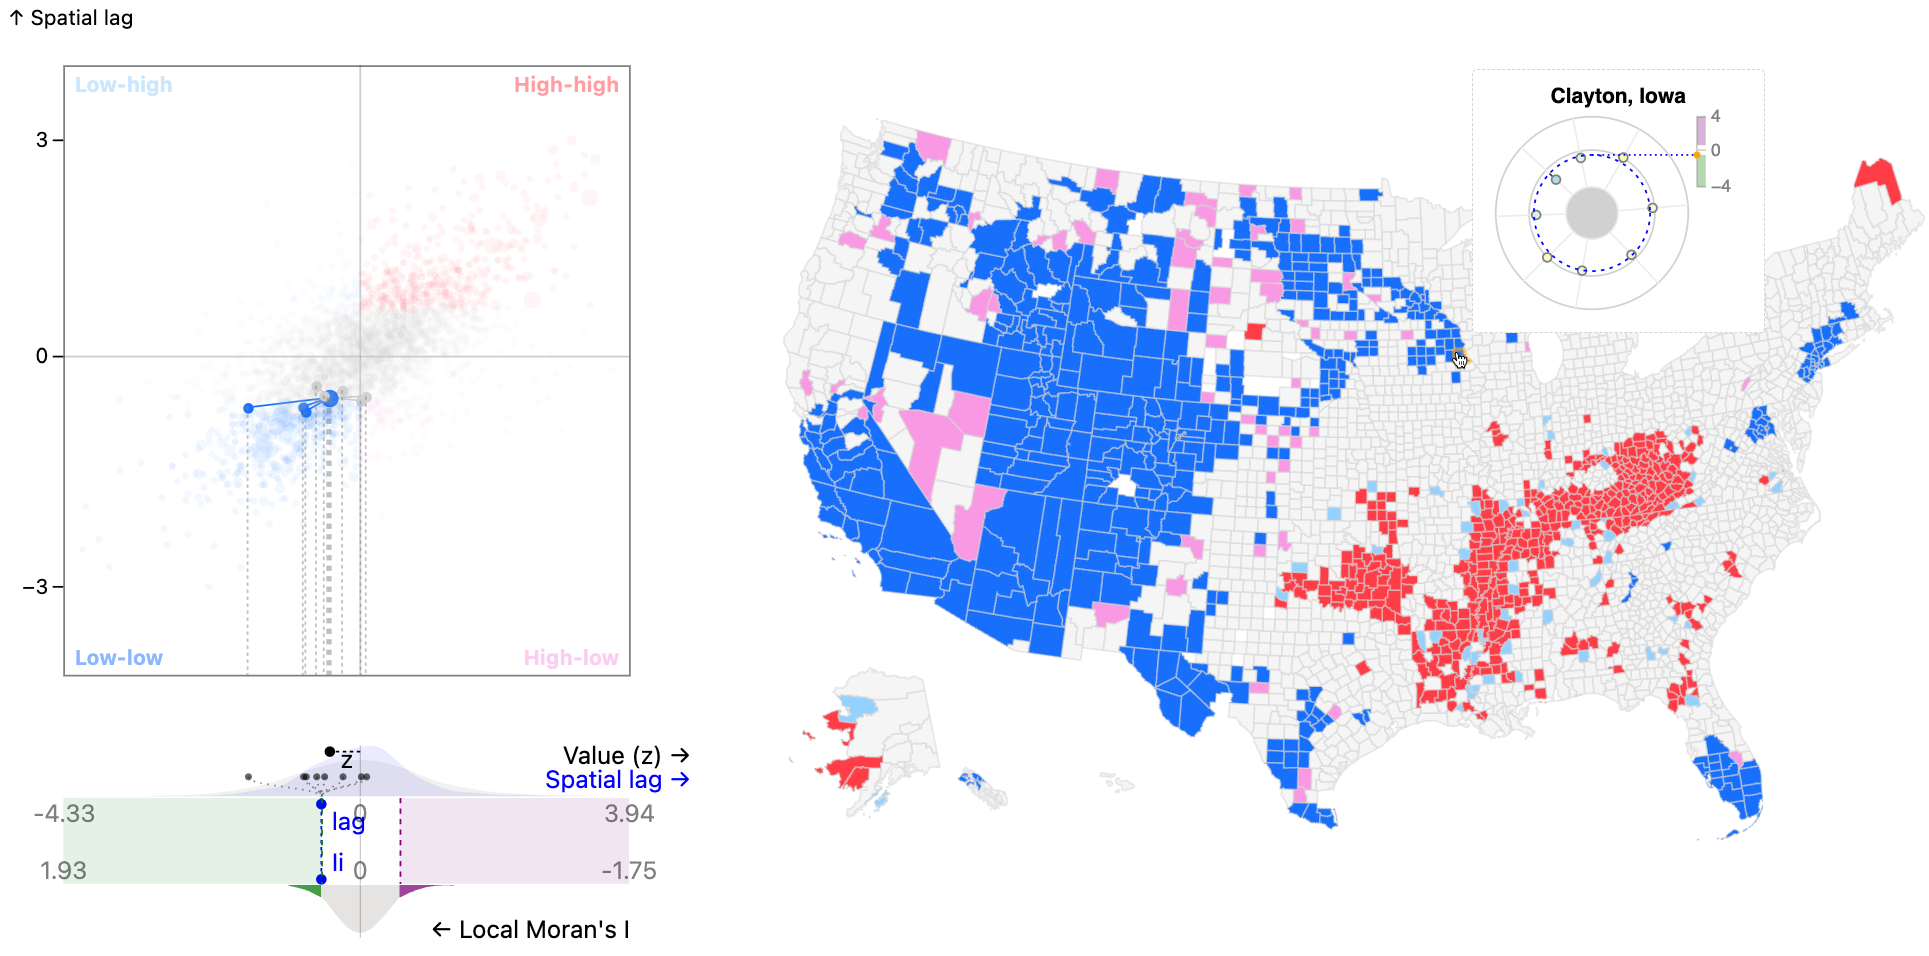
The MoranPlot library features several plots for visualizing Local Moran's I results. For more details and documentation, we recommend the Observable Notebook.
For a demonstration of the plots in action, check out the dashboard.
To import MoranPlot into your code as an ES6 module, use the following line of code:
MoranPlot = import("https://episphere.github.io/moranplot/src/export.js")