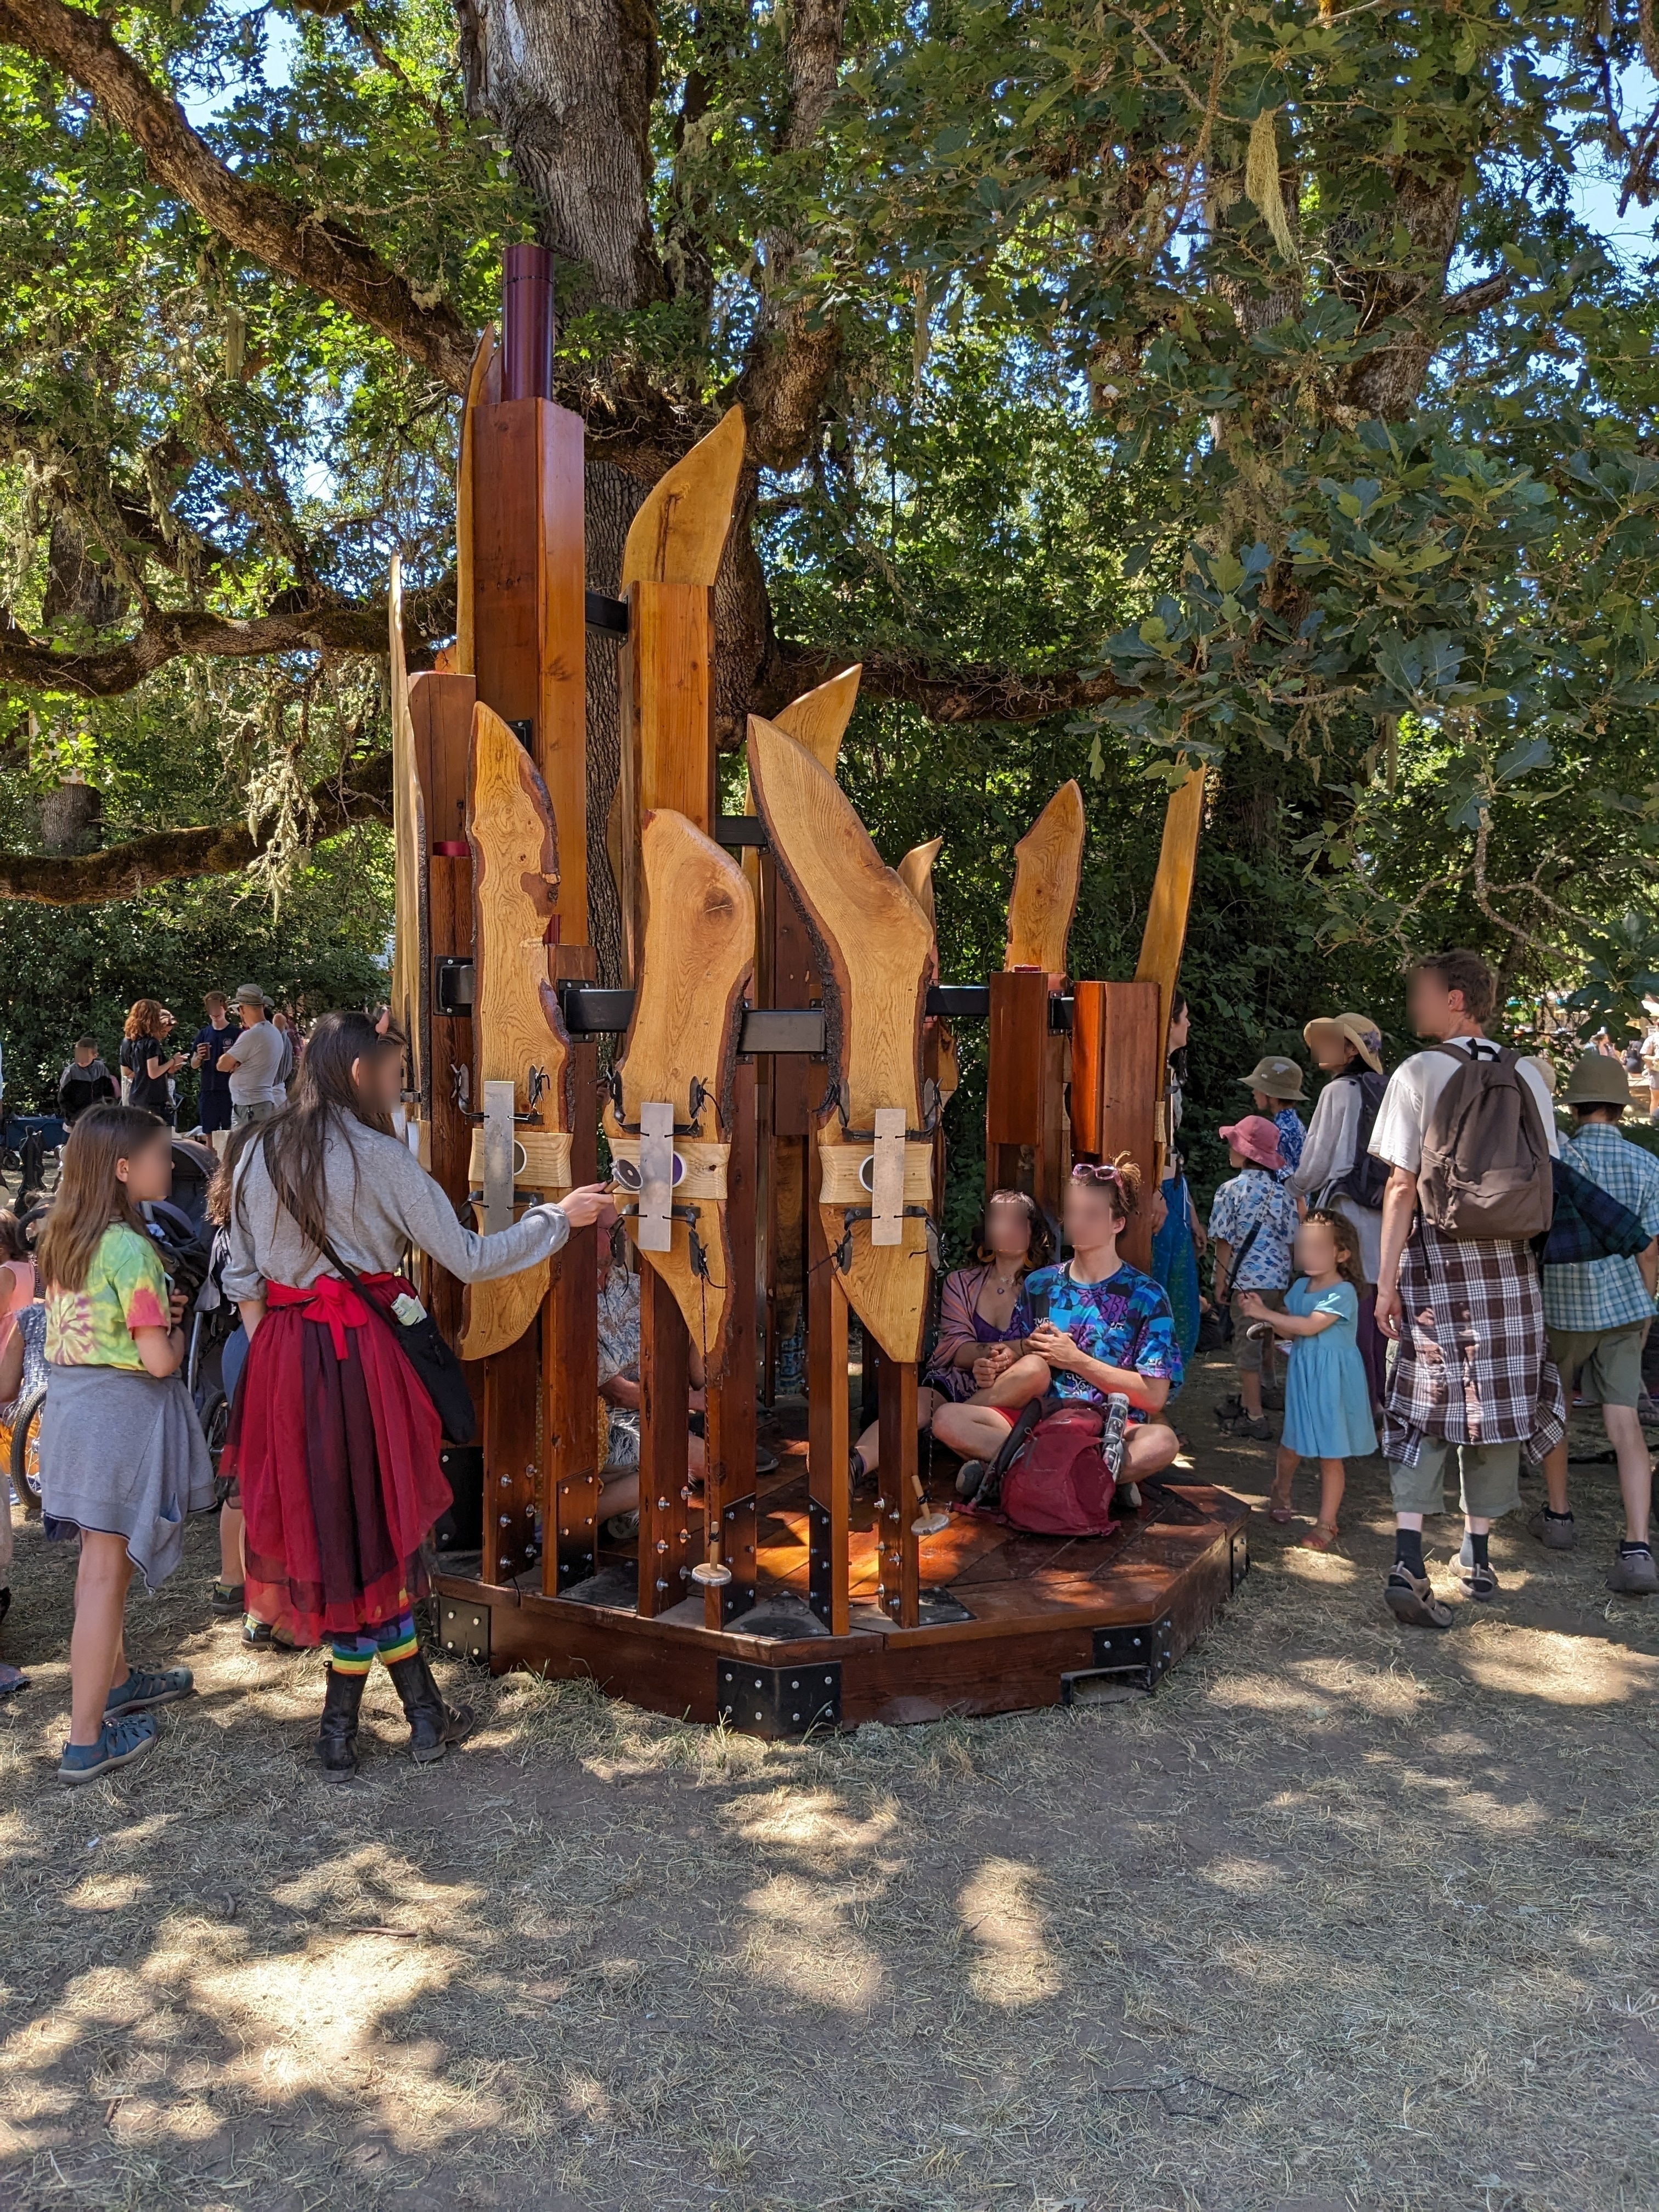
This repository contains source code that was used to control the lighting on an art installation called the Harmonic Throne.
The harmonic throne has 11 resonator tubes. In front of each resonator tube is a metal plate tuned to a harmonic frequency. When the plate is struck by a mallet the sound enters a resonator tube1 that is the length of a standing wave for the harmonic frequency of the metal plate. The central and tallest tube is 60hz, and each tube increments by 30hz to the smallest tube at 360hz.
At the top of each tube is an arduino nano, a max4466 electret microphone with a hand soldered bandpass filter, and 14 WS2812B LEDs. They are all wired to a central 12v battery through a 12v to 5v buck converter. The nanos are stored in a 3d printed enclosure and the microphones are sealed with sugru.
The code uses an interrupt to take microphone samples that are evenly spaced apart. Once enough samples are collected, we perform a Fast Fourier Transform (FFT). Once the FFT is completed, we look at the magnitude of the relevant frequency bin to determine the brightness for the LED strip. As the program runs the maximum magnitude is dynamically tracked in order to accomodate for variances among the microphones, bandpass filters, and how closely the FFT bin corresponds to the harmonic frequency.
Care must be taken when updating the brightness of the LED strip as the FastLED library disables all interrupts during the LED update process. Thankfully updating the LED brightness fits within a sample period. Tracking the time the last sample was taken allows us to wait until we just finished taking a sample before adjusting the LEDs.
The hue of the LEDs gradually shifts through all possible values (0-255) over the course of thirty minutes. This is accomplished by using a second interrupt to increment the hue.
The code that runs on each arduino is identical except for the tone number constant, and the possible change of the wiring pin for the microphone or LED strip.
The visualize-histogram.py file reads the output of the histogramFFTResults function that is sent over the USB serial connection. It then uses matplotlib to display an updating histogram of the FFT output. It was used to visualize the FFT calculation and microphone input during development and testing.
Footnotes
-
A resonator tube is a PVC pipe, which can easily be seen in the picture on the center 60hz tube. ↩
