Skip to content

jpradoar/prometheus_exporter

Folders and files

NameName
Last commit message
Last commit date

Latest commit


History

14 Commits


Repository files navigation

Write my own prometheus_exporter

The problem.

My applications dont expose metrics in "OpenMetrics" format, and I need to extract json data that is exposed in my them. This applications don't send any information outside, only expose json output in this format

  • app : port / metrics
  • service01:80/metrics

The idea/solution.

Write a prometheus_custom_expoter: CustomExporter

Generate a custom prometheus exporter to scrape all applications, extract json outputs, parse it, and finally transform all json in a OpenMetrics format to will be consumed by prometheus server and show it in grafana.
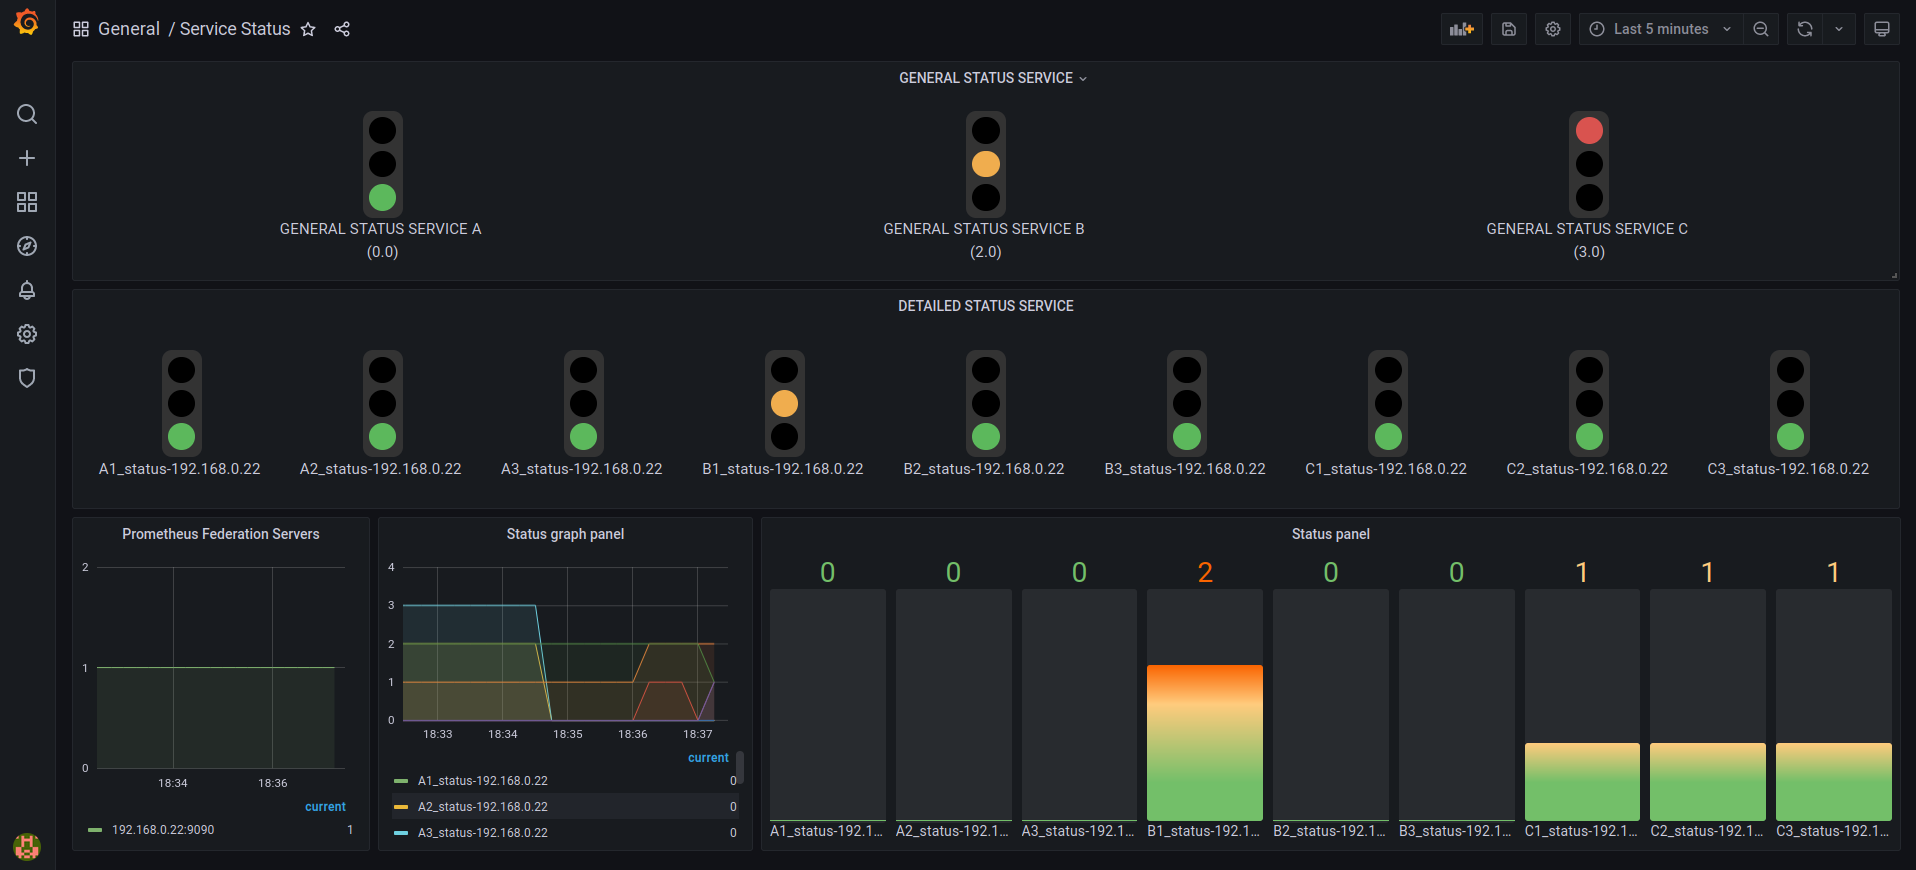
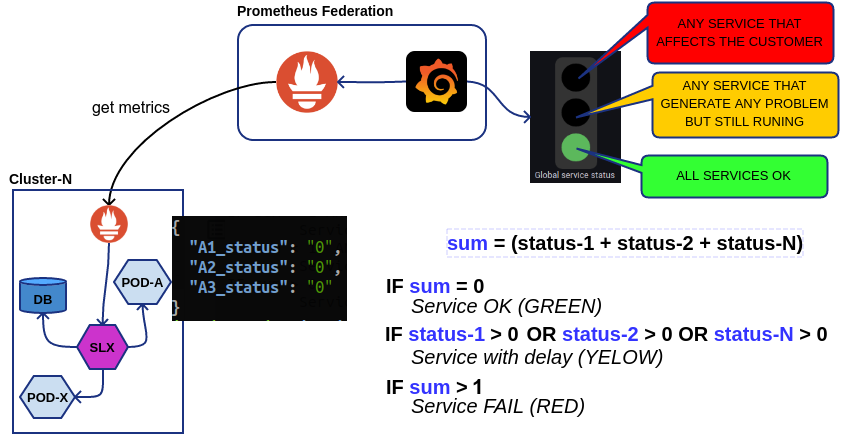
General dashboard status


Architecture


My app exposing their json outputs


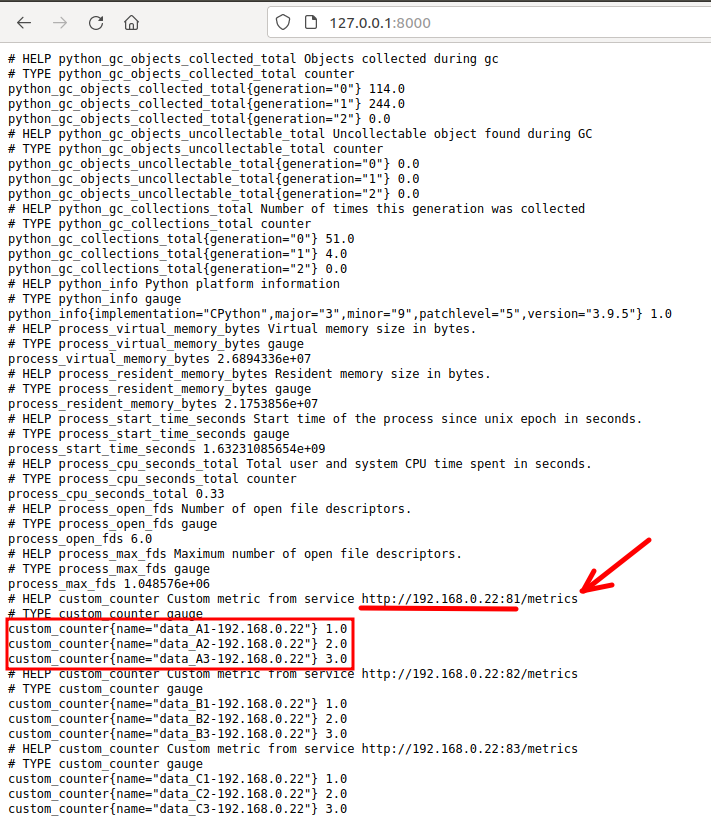
My Prometheus custom exporter consuming all service metrics :)


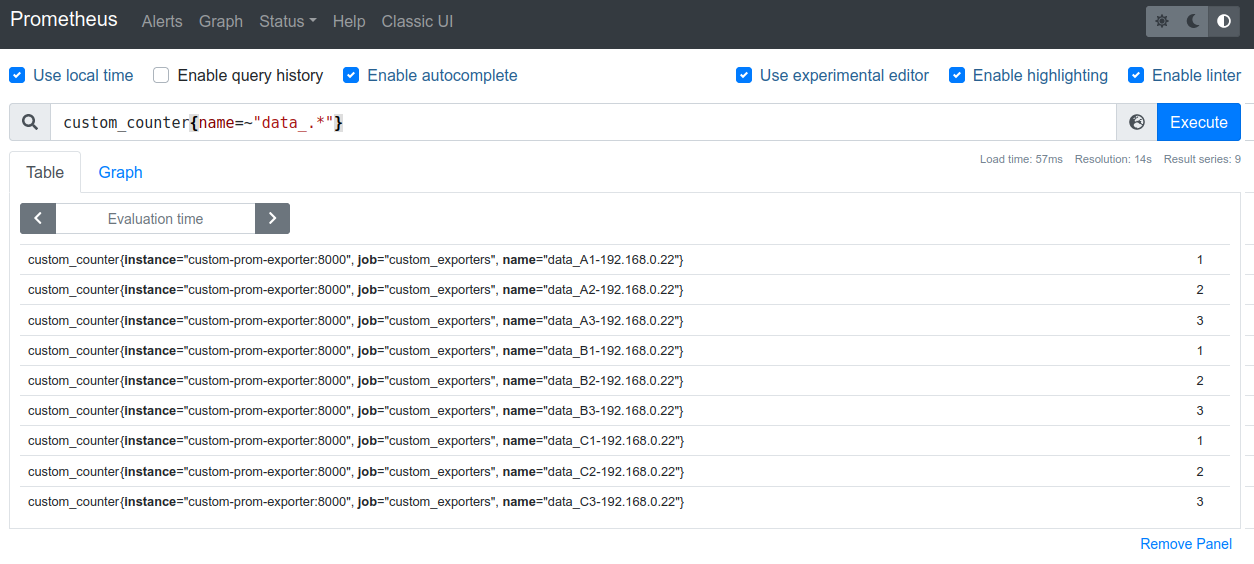
PromQL query to get all services


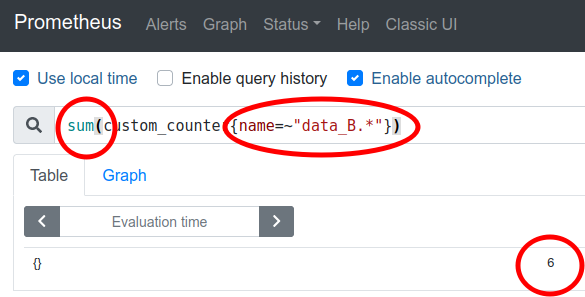
PromQL query to get sum of status

About

prometheus custom exporters

Resources

License

Stars

Watchers

Forks

Releases

No releases published

Packages

No packages published