

This tester provides a visual interface for interacting with your binary tree. More feaures for automated testing to be added. Have fun!
Clone this repository to your directory of choice.
Add your assignment .java files CatTree.java, CatInfo.java and any of your own classes to the assignment3 package, in the location of Put Your java files here.txt
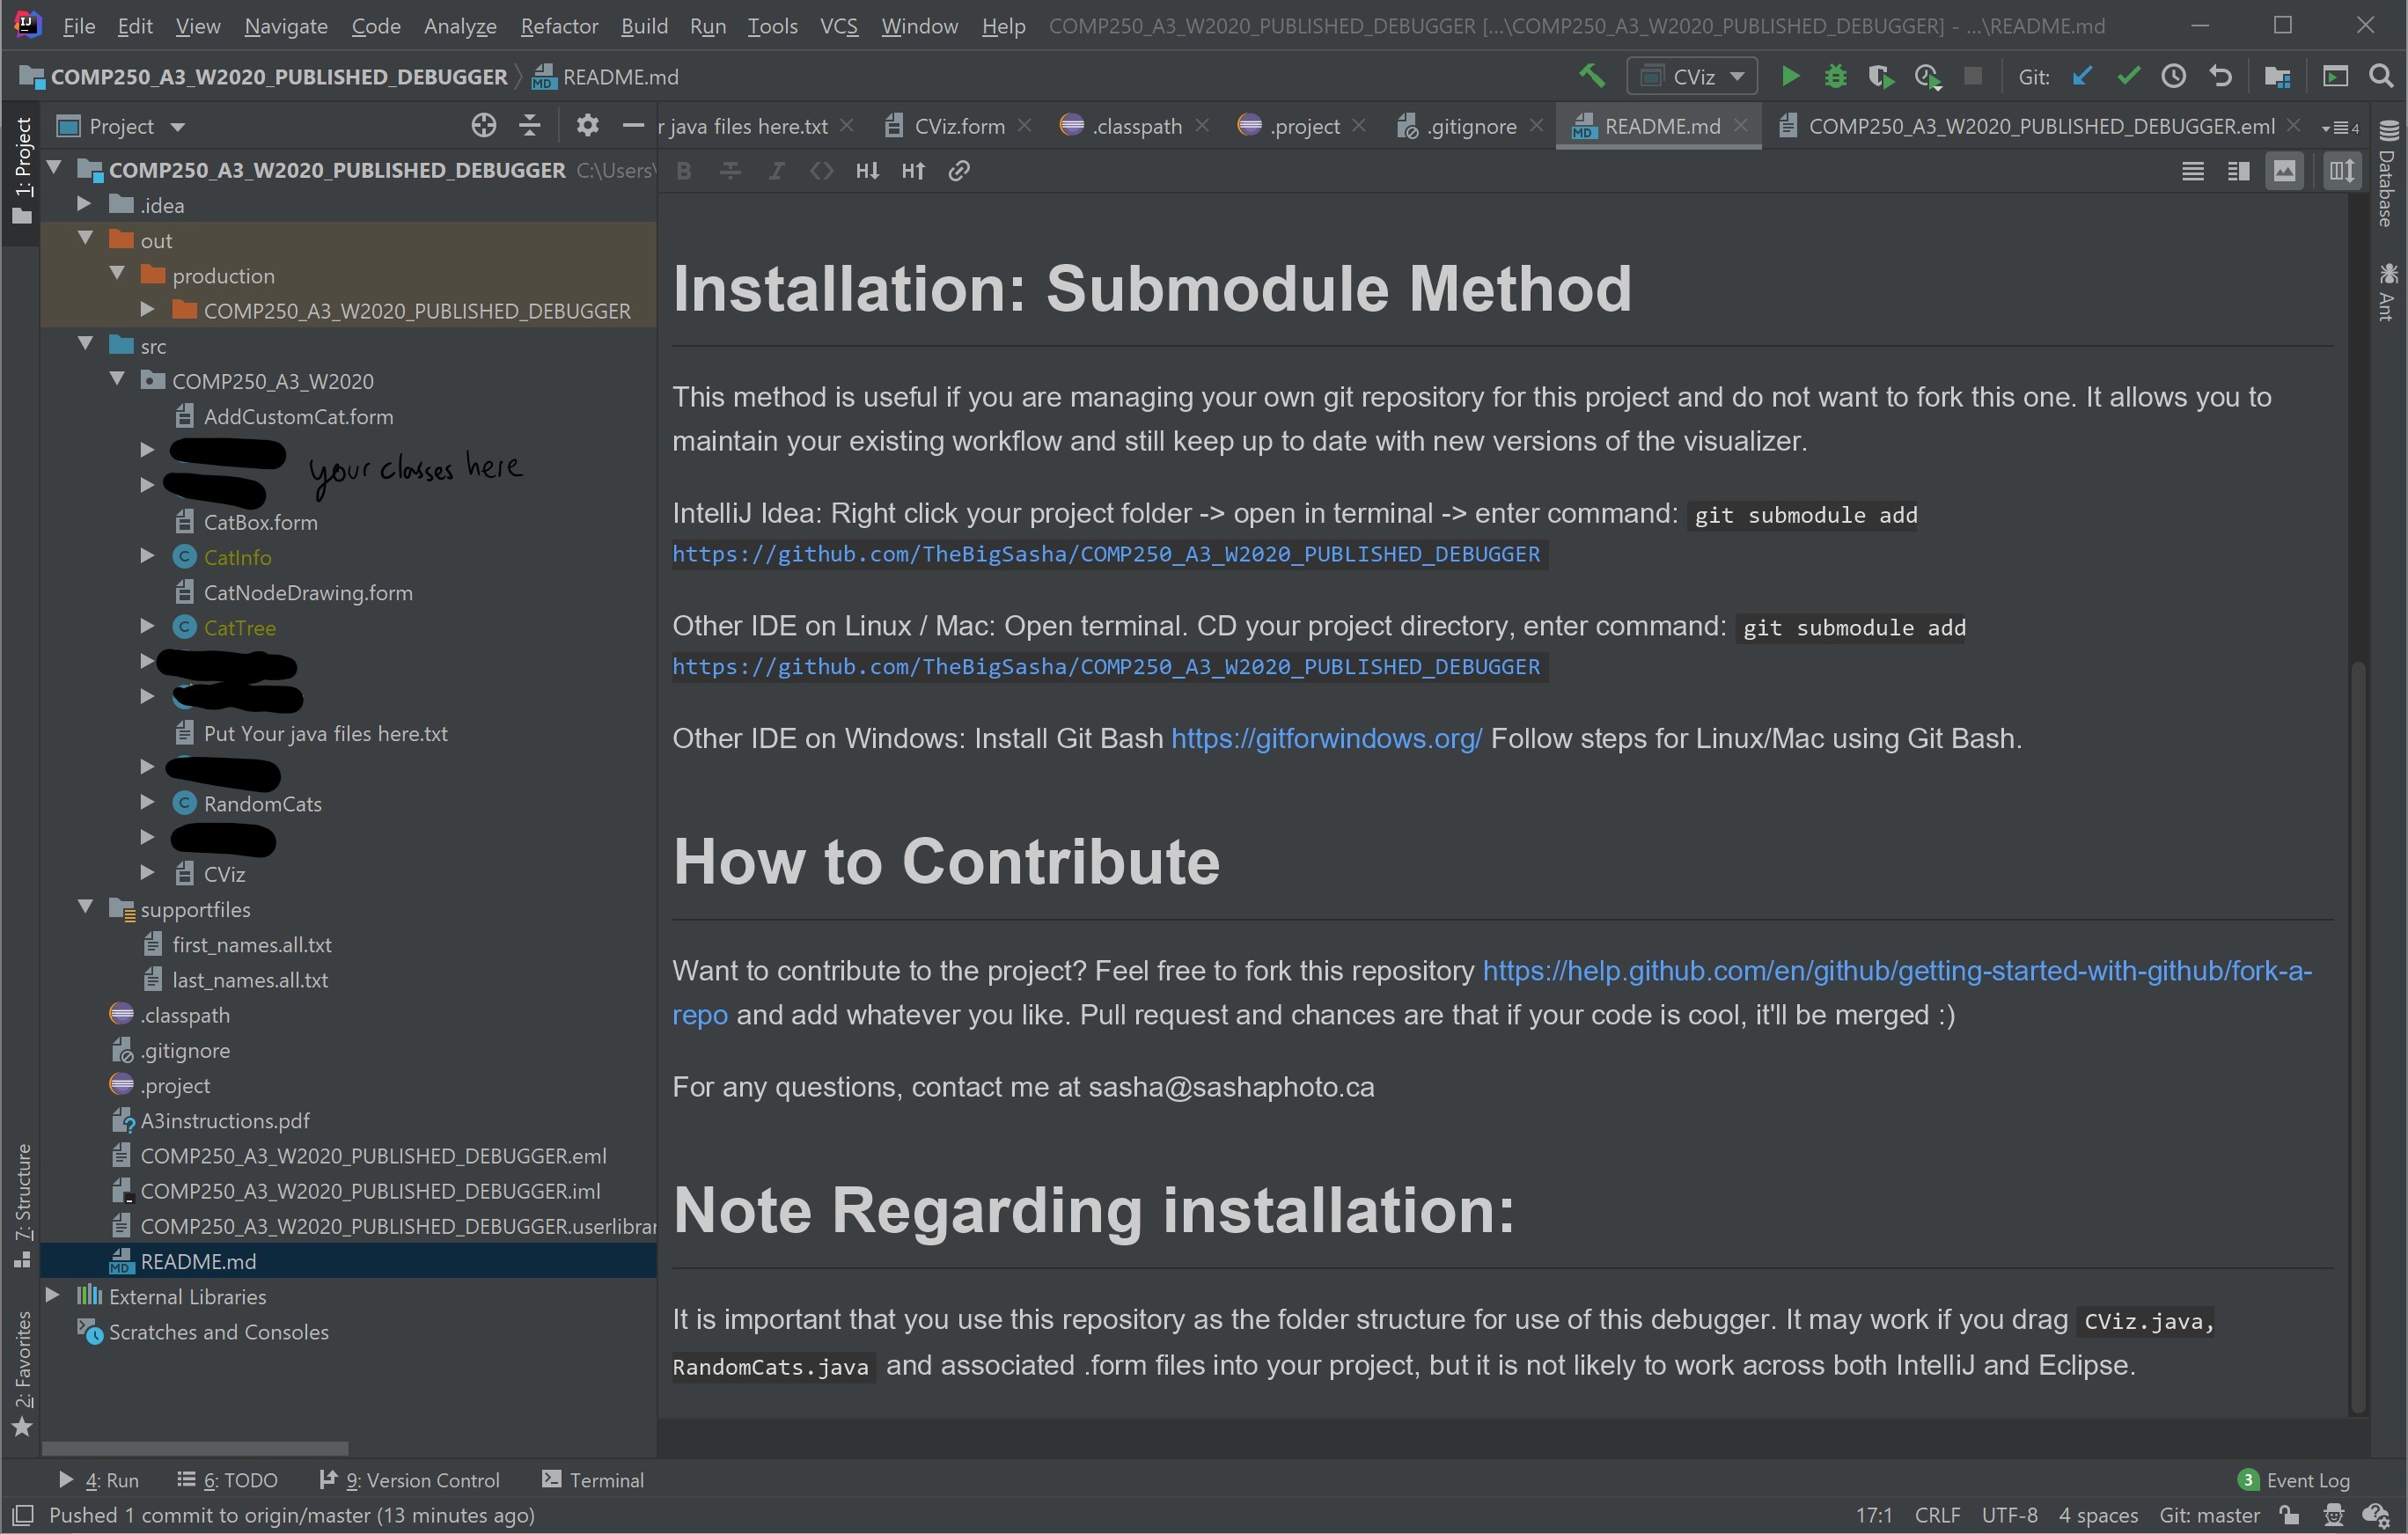
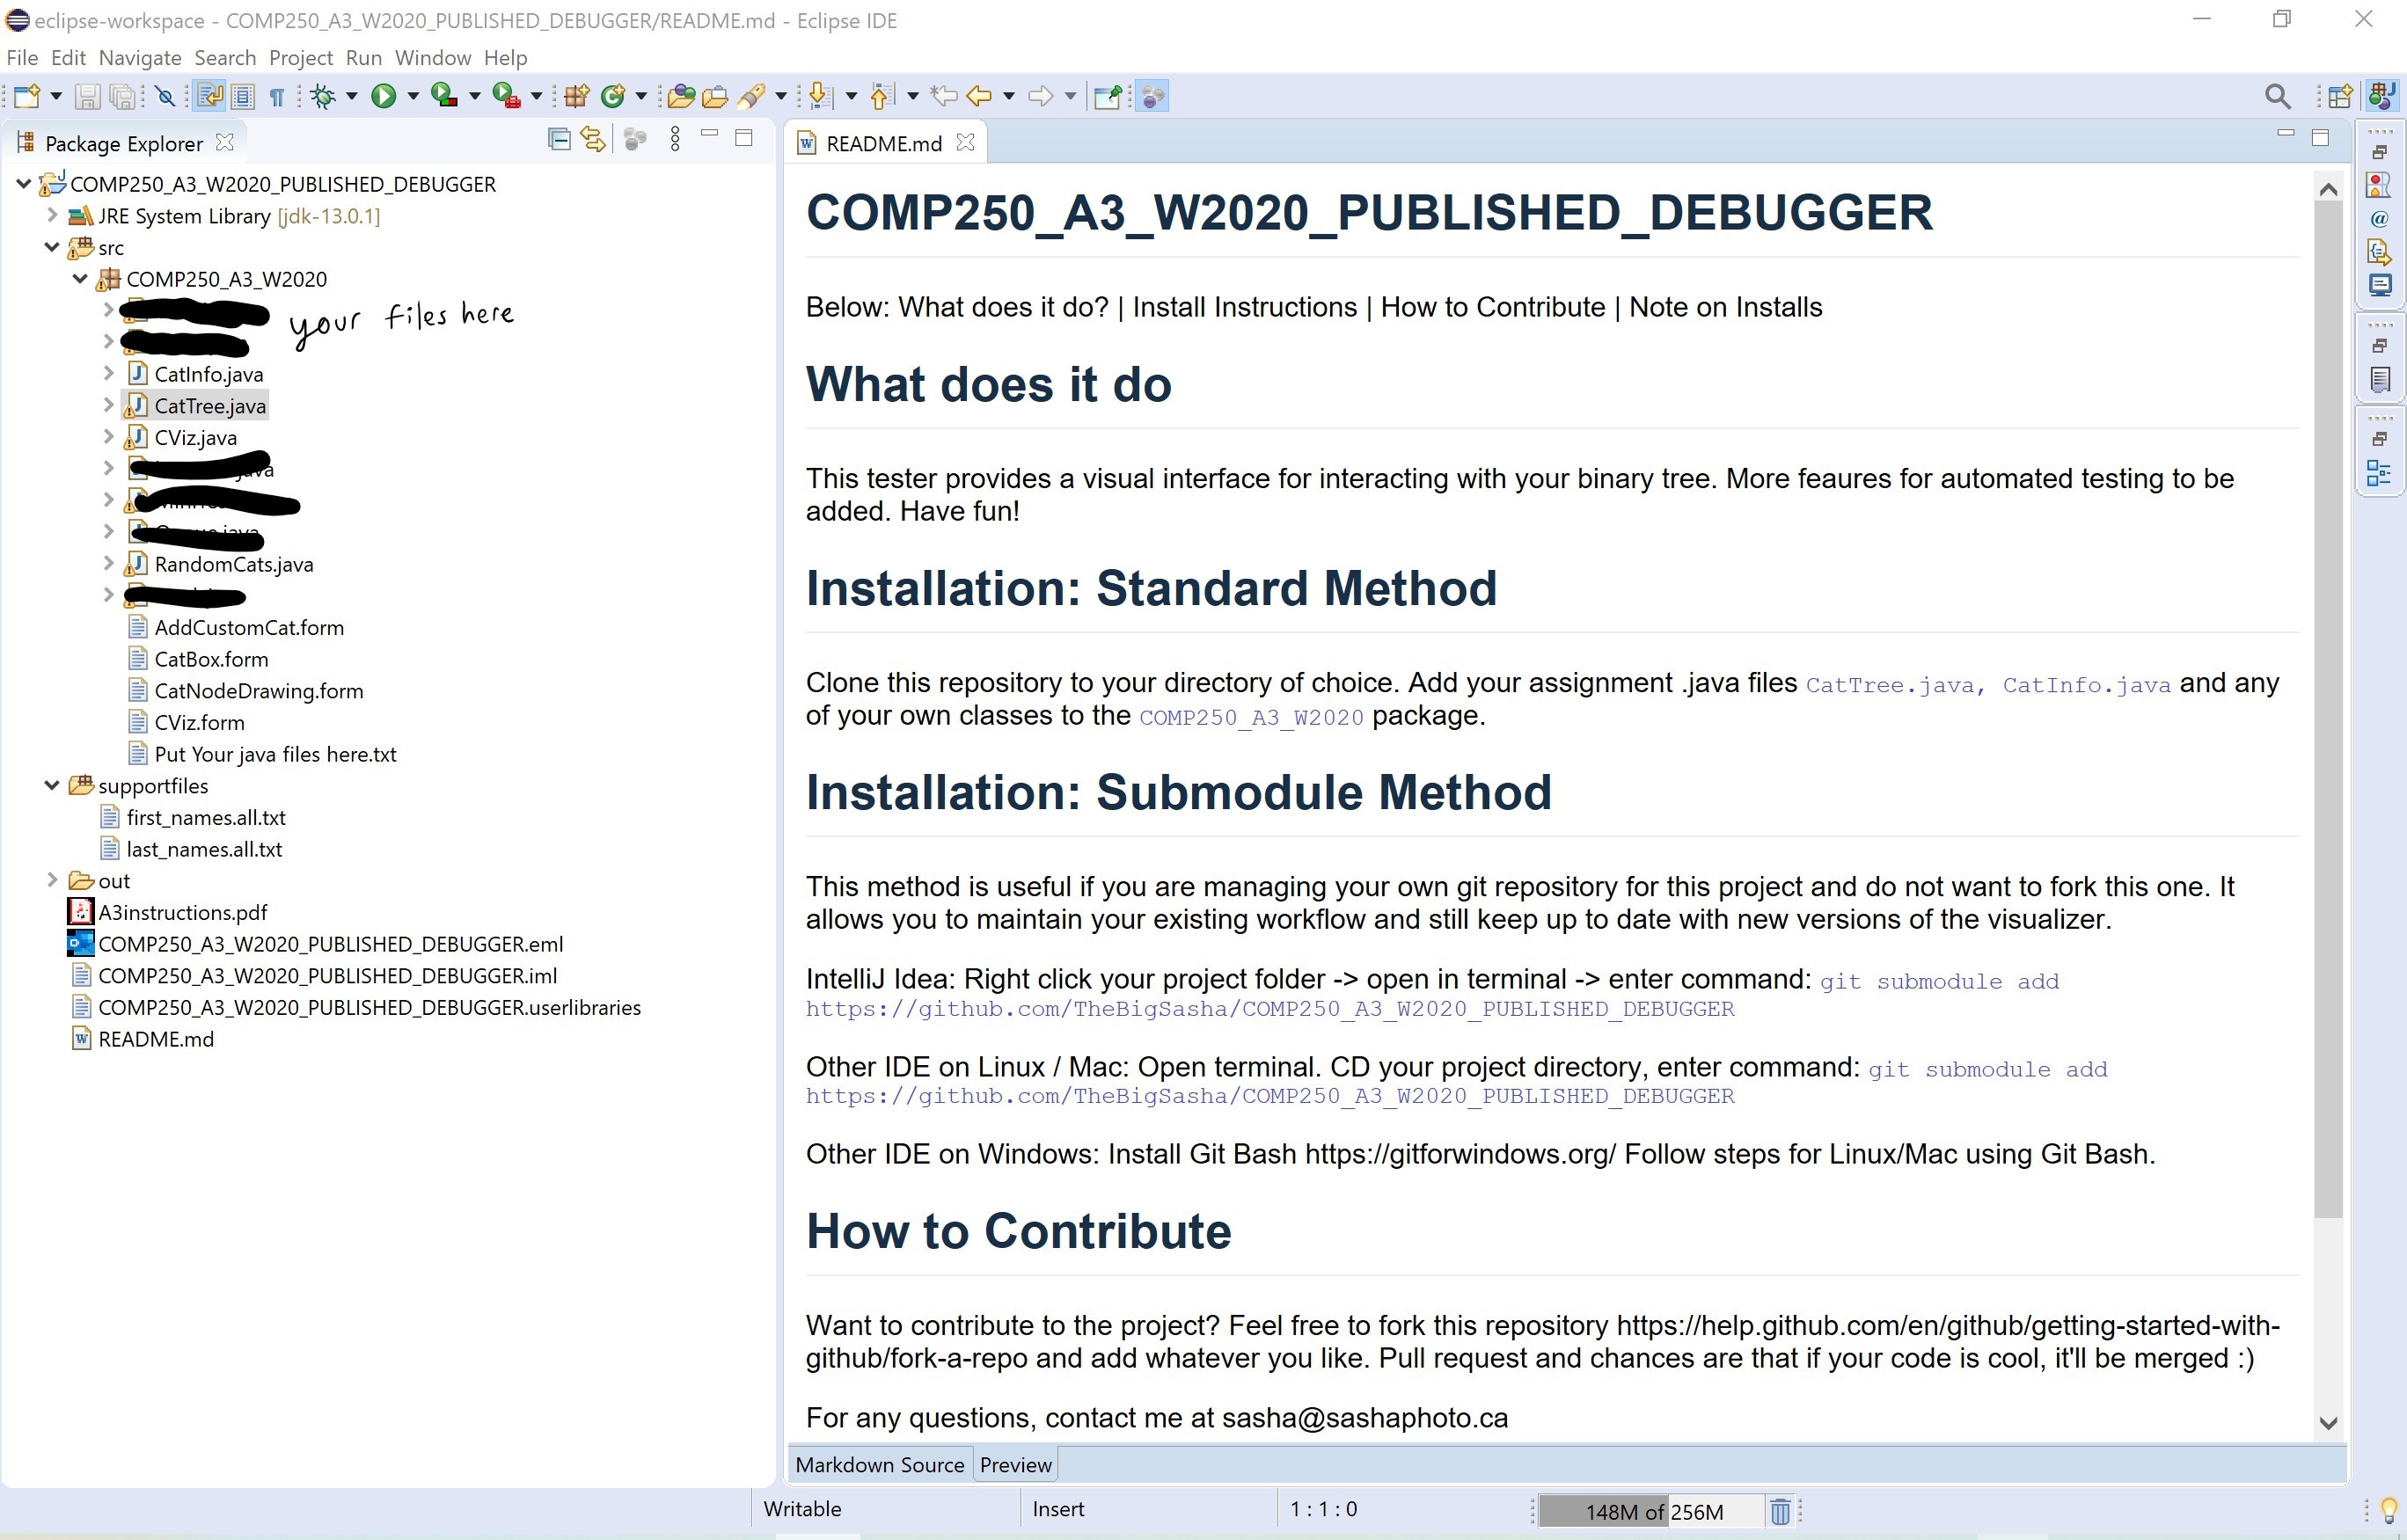
This method is useful if you are managing your own git repository for this project and do not want to fork this one. It allows you to maintain your existing workflow and still keep up to date with new versions of the visualizer.
IntelliJ Idea: Right click your project folder -> open in terminal -> enter command: git submodule add https://github.com/TheBigSasha/C250_Assignment3_Debugger
Other IDE on Linux / Mac: Open terminal. CD your project directory, enter command: git submodule add https://github.com/TheBigSasha/C250_Assignment3_Debugger
Other IDE on Windows: Install Git Bash Follow steps for Linux/Mac using Git Bash.
It is important that you use this repository as the folder structure for use of this debugger. It may work if you drag CViz.java, RandomCats.java and associated .form files into your project, but it is not likely to work across both IntelliJ and Eclipse.
Want to contribute to the project? Feel free to fork this repository and add whatever you like. Pull request and chances are that if your code is cool, it'll be merged :)
For any questions, contact me at [email protected]
Traverse the data structure, upon each traversal to the "next" node, draw a representation of the node on screen with a certain offset and display some information.
Start tree traversal at a node. Traverse through the subtrees, keeping track of pixel offset on each recursion. Draw a line connecting a node to the node being recursed to. Represent the linkedlist stored in each node with a visualization following loosely the visualization algorithm from assignment 2.
before initial traversal, calculate width and height of tree and scale offset factors to fill the window size for any tree.
Use non-linear / non-randomized offets of some kind to reduce overlap with dense trees.
Visualize the tree traversal by highlighting the "current" node as in the A2 debugger. This would require access/modificiation to assignment source code.