Gantt chart
Project Plan is able to produce a basic Gantt chart, which is automatically rendered in the Gantt Chart tab when a project is successfully compiled. This chart is generated using the same resource schedules in the Output tab.
By default, the horizontal bars of the chart can be ordered according to start and end dates. They can also be grouped using the Group by drop-down. The available grouping values are: None (the default), Resource or WorkStream.
These groupings can also be annotated using the Annotation Style drop-down, which wraps the groupings in highlighted boxes. The available annotation style values are: None (the default), Plain (the boxes are highlighted in light blue) or Color (the boxes are highlighted with the color of the corresponding resource or workstream).
Annotated groups can be labelled using the Label Groups switch, which displays the name of the corresponding resources or workstream at the top left corner of the highlighted annotation box.
The project finish time can also be added to the top right corner of the chart using the Show Project Finish switch. This value will either be displayed as a number or as a date, depending on whether the Show Dates option is toggled under the Settings menu.
Finally, any tracking values that exist in the Tracking tab can be highlighted in the chart using the Show Tracking switch.
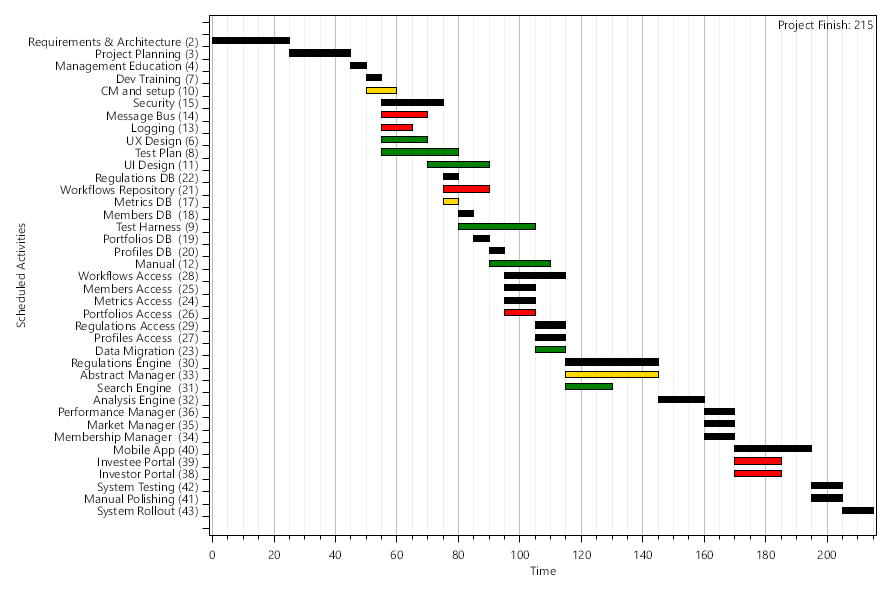
Here is an example of a basic Gantt chart:
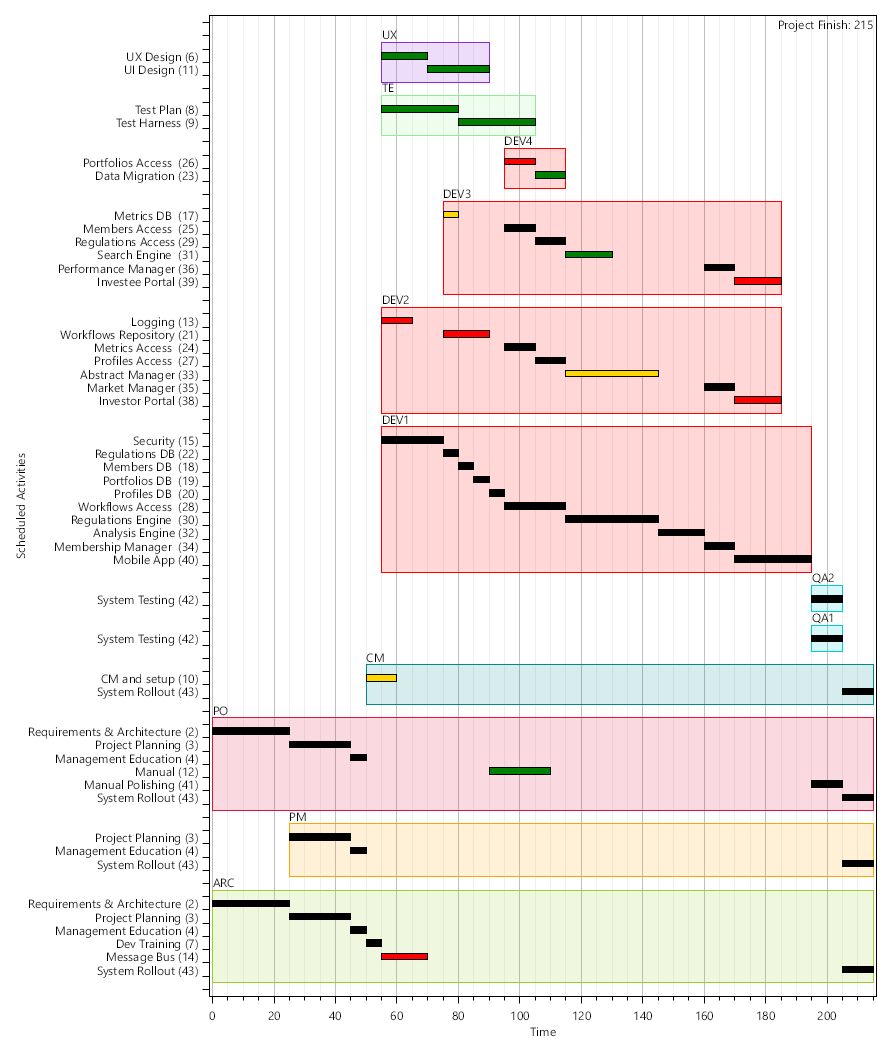
Here is an example of a grouped and annotated Gantt chart:
For more details see: