Outputs
By default, a project name will appear as Untitled in the title bar until it is saved to a named file. For example, if a project is saved to a file called MyExample.zpp, then the name will appear in the title bar as MyExample. As soon as you insert or edit any data in the project, then an asterisk is prepended to project name in order to signify its unsaved status (e.g. *MyExample).
You can save a new project to file via the menu bar (File -> Save As...). This will open a dialog window allowing you to specify the name and location of the new file.
You can save an existing project to file via the menu bar (File -> Save) or via the keyboard shortcut (Ctrl+S).
An example file can be found here.
Project Plan can also export raw and calculated data to an Excel file. The format is similar to the an imported Excel file (see Inputs), but also contains various columns or worksheets that include calculated data.
Additional calculated data exported in the file includes values for rendering the Gantt chart (see Gantt chart), the resource allocation chart values, resource dependencies for activities, and earned-value analysis data (see Earned-value analysis).
You can export an Excel file via the menu bar (File -> Export...).
An example file can be found here.
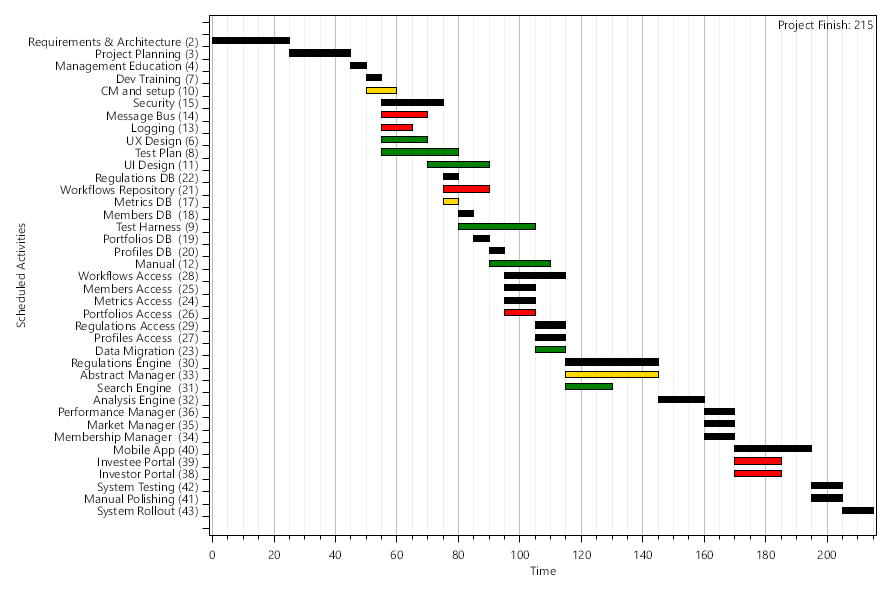
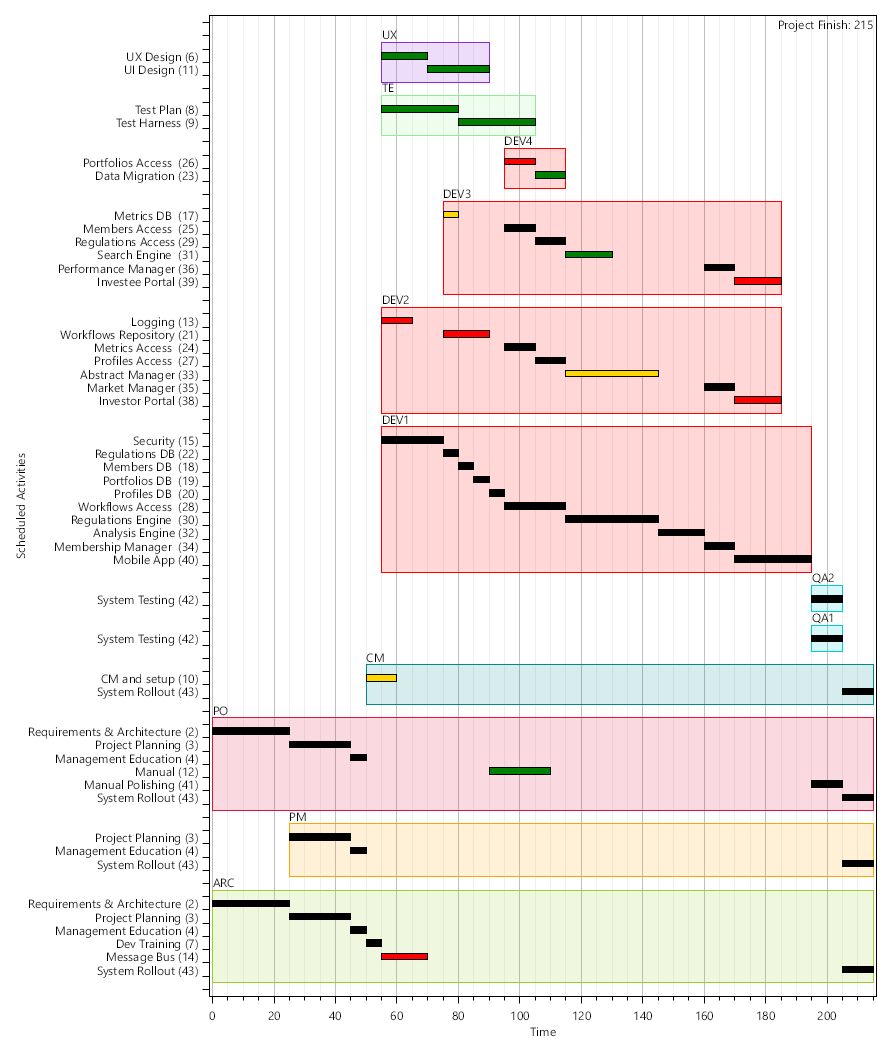
When a project is successfully compiled, the Gantt chart for the plan will appear on the Gantt Chart tab. The bars in the chart can be grouped by resource, work stream, or not at all using the Group by drop-down. The chart can also be annotated according to the grouping using the Annotation Style drop-down. Groups can be labelled using the Label Groups switch. The project finish time can also be added to the top right corner of the chart using the Show Project Finish switch. Any tracking values can be highlighted in the chart using the Show Tracking switch.
A Gantt chart can be saved by right-clicking on the chart and selecting Save As.... The chart can be saved as a JPEG, PNG, or PDF.
Note: when exporting the chart the width is determined by the size of the image displayed on screen. However, the height will be altered to accommodate any text or annotations.
Here is an example of a basic Gantt chart:
Here is an example of a grouped and annotated Gantt chart:
For more details see:
When a project is successfully compiled, the arrow graph for the plan will appear on the Arrow Graph tab. This image is static, but it can be zoomed and panned. The graph is constructed according to the project activity network and the Arrow Graph Settings.
An arrow graph can be saved by right-clicking on the image and selecting Save As.... The image can be saved as a JPEG, PNG, PDF, SVG, GraphML, or GraphViz.
An arrow graph exported as GraphML format can be easily rendered on screen using tools such as yEd, which allows for custom presentation of the activity network.
Here is an example of an arrow graph:
![]()
For more details see:
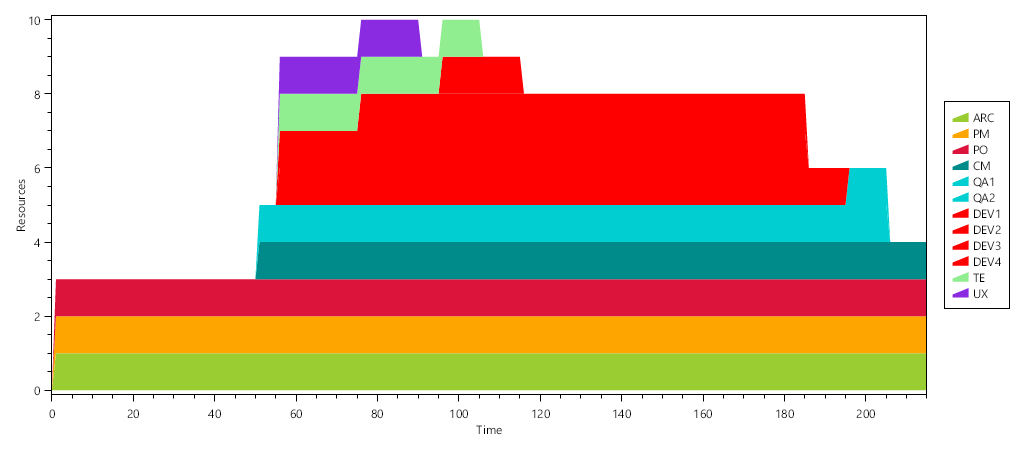
When a project is successfully compiled, a resource chart will be automatically generated in the Resource Chart tab. This chart is constructed according to how the various activities are allocated to the project resources, and the Resource Settings.
A resource chart can be saved by right-clicking on the chart and selecting Save As.... The chart can be saved as a JPEG, PNG, or PDF.
Note: when exporting the chart the width and height are determined by the size of the image displayed on screen.
Here is an example of a resource chart:
For more details see:
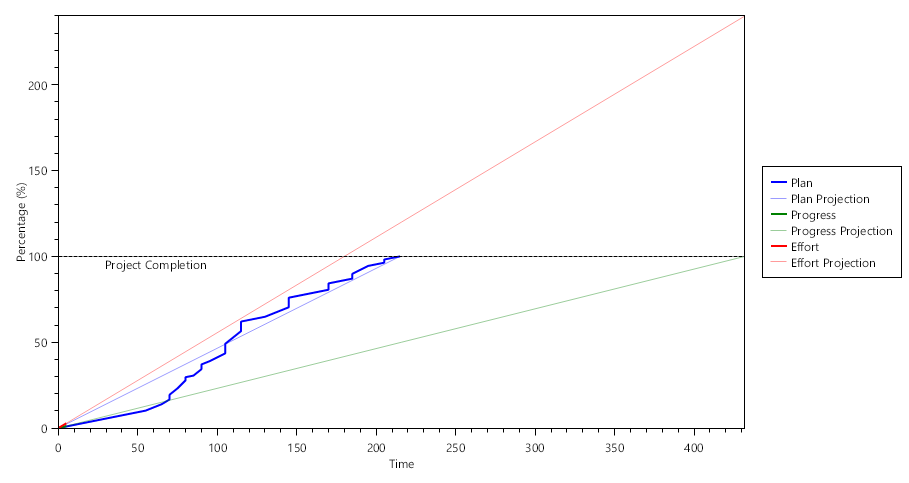
When a project is successfully compiled, an earned-value chart will be automatically generated in the Earned-Value Chart tab. This chart is constructed according to the project activity network. Any projections for planning, progress or effort can be added using the View Projections switch.
An earned-value chart can be saved by right-clicking on the chart and selecting Save As.... The chart can be saved as a JPEG, PNG, or PDF.
Note: when exporting the chart the width and height are determined by the size of the image displayed on screen.
Here is an example of a basic earned-value chart:
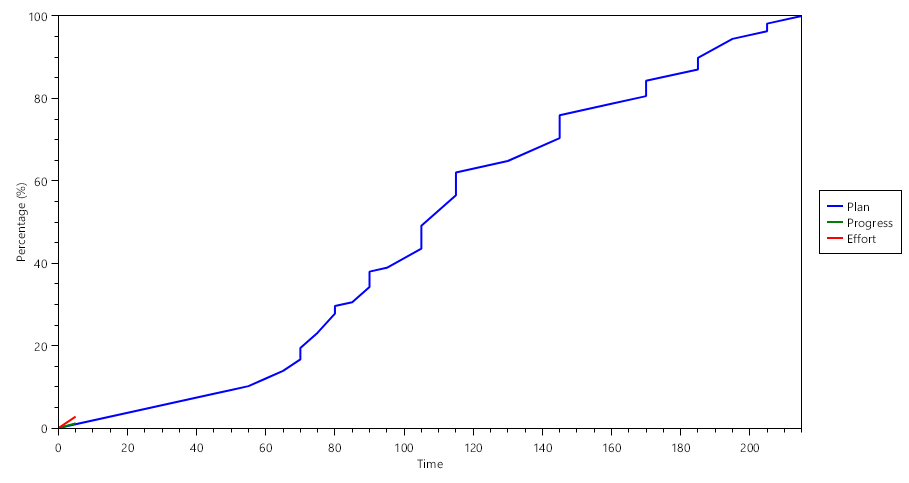
Here is an example of an earned-value chart with projections:
For more details see: